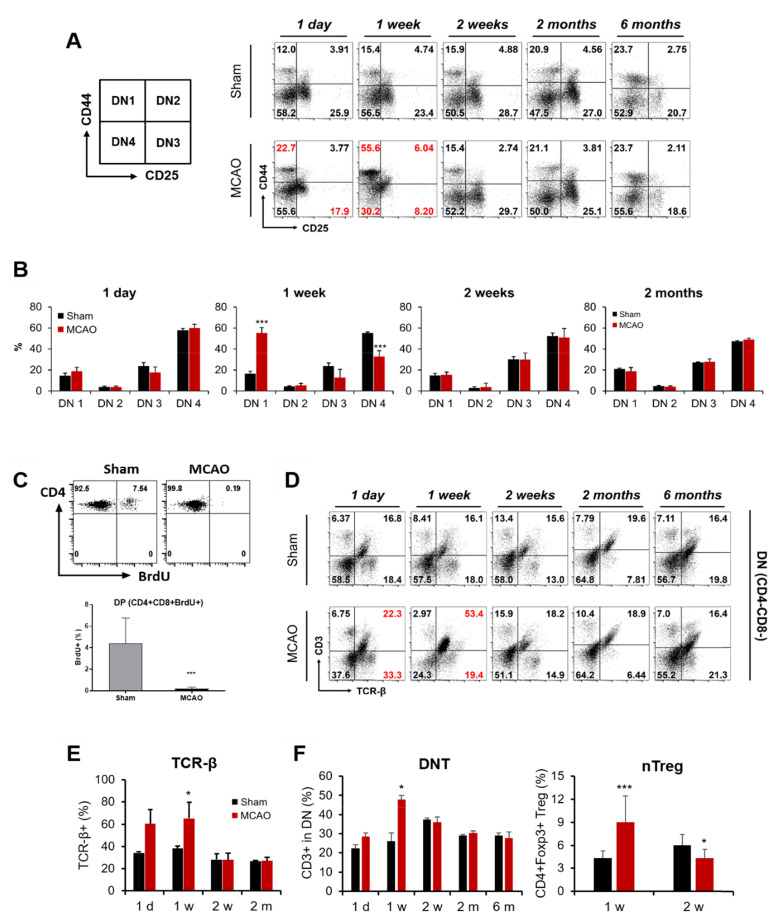
Fig. 3.
Impairment of thymocyte development after tMCAO. (A) DN stages of thymocytes were analyzed according to CD44 and CD25 expression. Number marked in red in FACS data indicate values that differ from those of sham-operated mice. (B) Percentage of DN subpopulation is shown. (C) Thymocyte proliferation was measured using BrdU assay. (D, E) The percentage of TCR-β subpopulations was analyzed in the DN population. (F) CD4-CD8-CD3+ DNT (double-negative T cell) and CD4+Foxp3+ nTreg (natural regulatory T cell) were analyzed in thymus. Numbers of mice were (n=sham/tMCAO): 1 d (n=6/8), 1 w (n=9/9), 2 w (n=11/17), 2 m (n=14/16), 6 m (n=9/29). *p≤0.05 and ***p≤0.001.

