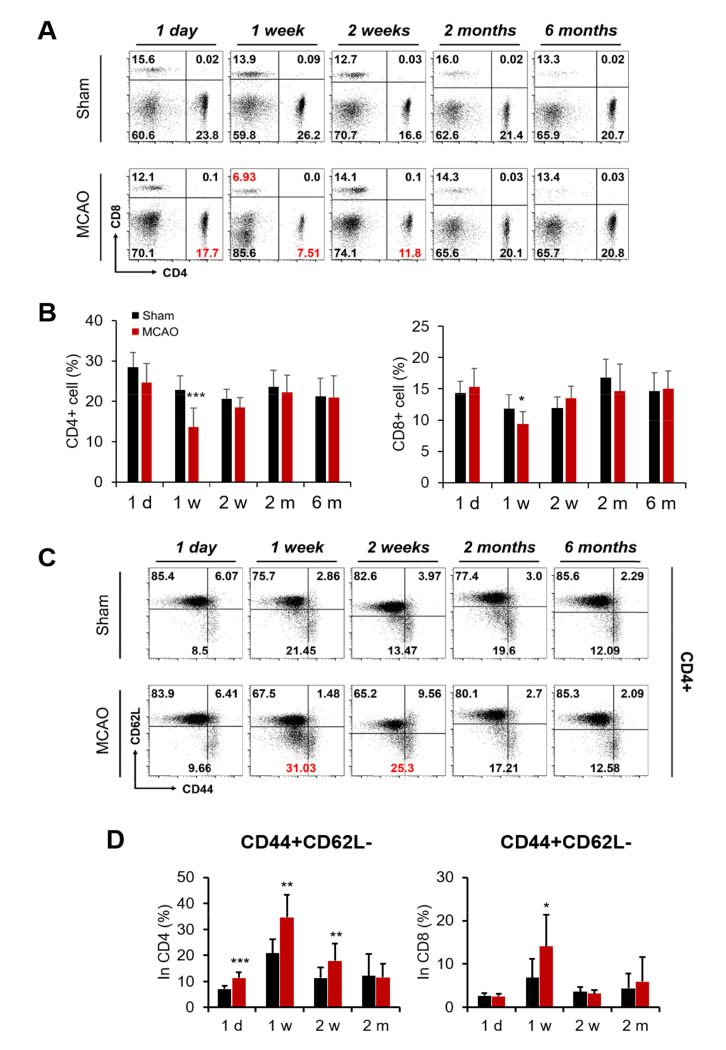
Fig. 5.
T lymphocyte population and phenotype in the blood after tMCAO. (A) Representative CD4 and CD8 T lymphocyte population plots are shown. Numbers marked in red in the FACS data represent values that differ from those for sham mice. (B) Percentages of CD4+ and CD8+ T lymphocytes subpopulations were analyzed. (C, D) CD44+CD62L- effector cells were analyzed in T lymphocytes. Mice numbers were (n=sham/tMCAO): 1 d (n=8/8), 1 w (n=8/7), 2 w (n=11/12), 2 m (n=15/13), and 6 m (n=9/29). *p≤0.05, **p≤0.01, and ***p≤0.001.

