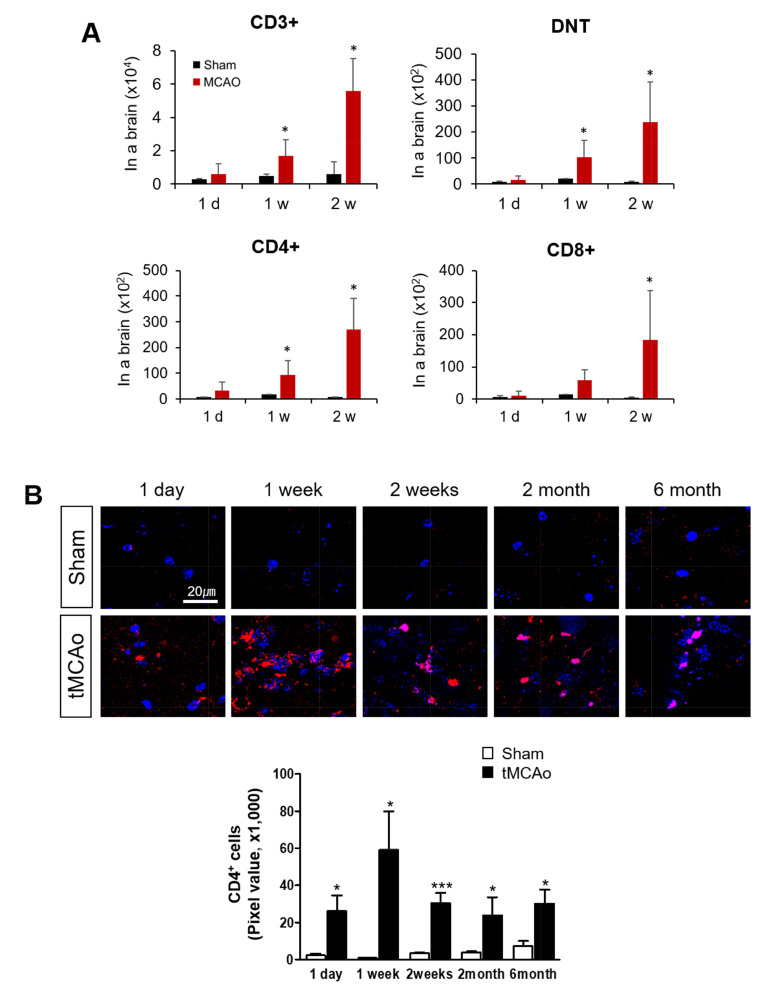
Fig. 6.
Analysis of brain T cells after tMCAO. (A) Absolute cell numbers of brain CD3+ T cells, DNTs, CD4+, and CD8+ T cells were analyzed using FACS. To obtain the required cell numbers, brain T cells were analyzed by pooling samples from the ipsilateral hemispheres. A total of 4~8 brains were combined per sample from sham-operated mice and 2~4 brains were combined per sample from tMCAO mice. The number of independent experiments was three at one day and two weeks and four at one week. All data were pooled for analysis. Mice numbers were (n=sham/tMCAO): 1 d (n=5/9), 1 w (n=27/17), and 2 w (n=18/18). (B) Brain tissues were processed for immunohistochemical analysis from one day to six months post-tMCAO. Fluorescence images of CD4 (red) and DAPI (blue). Quantification of CD4+ levels in the striatum of mouse with tMCAO. Scale bar=20 µm. Mice numbers were (n=sham/tMCAO): 1 d (n=3/3); 1 w (n=3/3), 2 w (n=5/3), 2 m (n=5/6), and 6 m (n=4/11). *p≤0.05 and ***p≤0.001.

