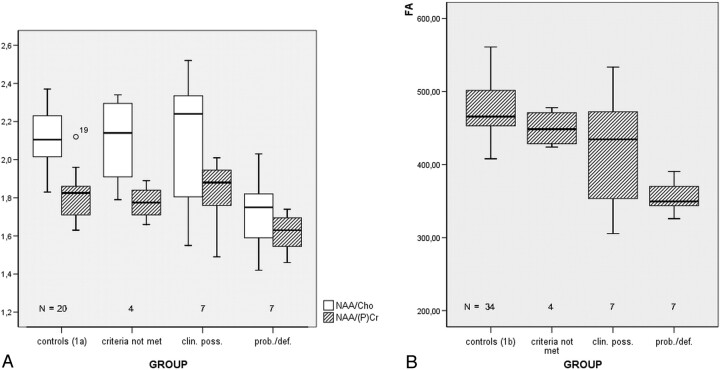
Fig 2.
A, NAA/Cho and NAA/PCr metabolite ratios for patient subgroups and controls. Both parameters are lowest in group IV (EE probable/definite [prob./def.]). B, FA boxplots of the central region for groups I–IV. Mean FA values of groups III (EE clinically possible [clin. poss.]) and IV (prob./def.) were markedly lower in the upper 3 regions of measurements (Table 3).

