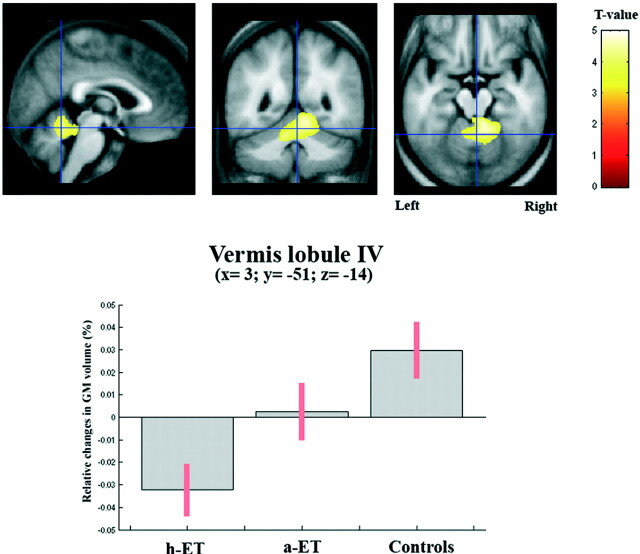
Fig 2.
Results from an optimized VBM analysis showing significant cerebellar atrophy at the level of the anterior lobe, above that occurring globally, selectively in patients with both a-ET and h-ET (Pcorrected < .001). Data analyses have been further corrected for age and sex. The maps are superimposed on the T1-weighted image averaged across all participants. The bar graphs give the mean and SD GM volume of voxels showing peak differences in the vermis. Patients with only a-ET display a tendency toward a CV loss.

