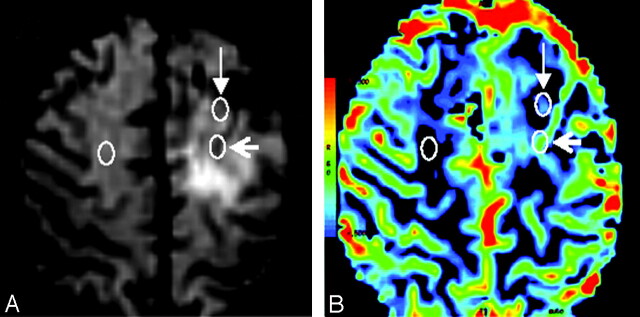
Fig 1.
T2*-weighted image during maximum arterial signal intensity drop (A) and rCBV map (B) in low-grade OD, demonstrating the position of ROIs used to calculate rCBVmax. Method 1 (open arrowhead, posterior ROI in the left cerebral hemisphere, overlying an intratumoral vessel) and method 2 (closed arrowhead, anterior ROI in the left cerebral hemisphere, lying outside intratumoral vessels). The mean CBV from contralateral normal-appearing white matter (ROI in the right cerebral hemisphere) was used to normalize the data for each method. White circles have been superimposed on the original color-coded ROIs generated by FuncTool.

