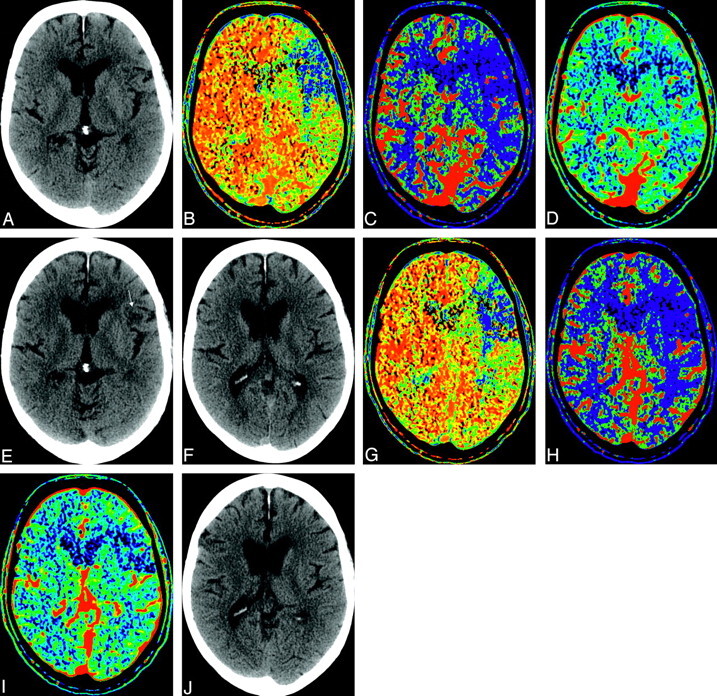
Fig 1.

A 66-year-old patient who had right hemiparesis and underwent CTP after 65 minutes from stroke onset. Presented are maps from 2 adjacent levels as examples of reversal or decrease of CBV abnormal area. The patient was treated with intravenous thrombolysis. A, Baseline noncontrast CT. B, MTT map. C, CBF map. D, CBV map. E, Follow-up CT. F–J, Images from the next level, respectively. There is a single small infarct (arrow) seen only on 1 section at follow-up.
