
Fig 2.
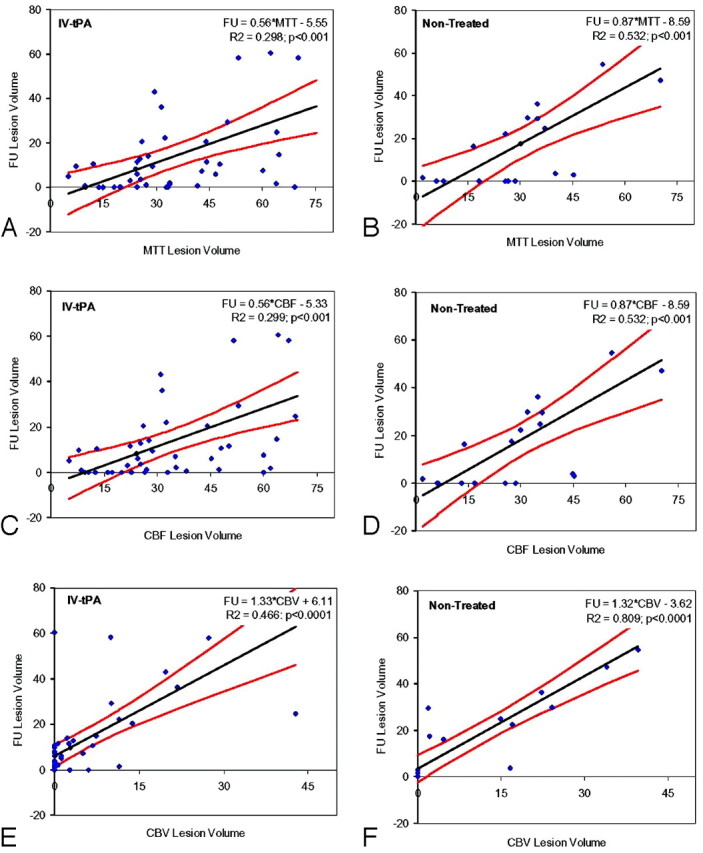
Scatter diagrams show initial lesion volume (milliliters) obtained by region-of-interest analysis of CBV, CBF, and MTT maps versus infarct size (mL) assessed on the follow-up (FU) CT scan. A and B, MTT lesion volumes in treated (A) and nontreated (B) cohorts. Presented are the regression line, 95% confidence bands, and the coefficient of determination (R2). C and D, CBF lesion volumes in treated (A) and nontreated (B) cohorts. Presented are the regression line, 95% confidence bands, and the coefficient of determination. E and F, CBV lesion volumes in treated (A) and nontreated (B) cohorts. Presented are the regression line, 95% confidence bands, and the coefficient of determination. IV indicates intravenous.