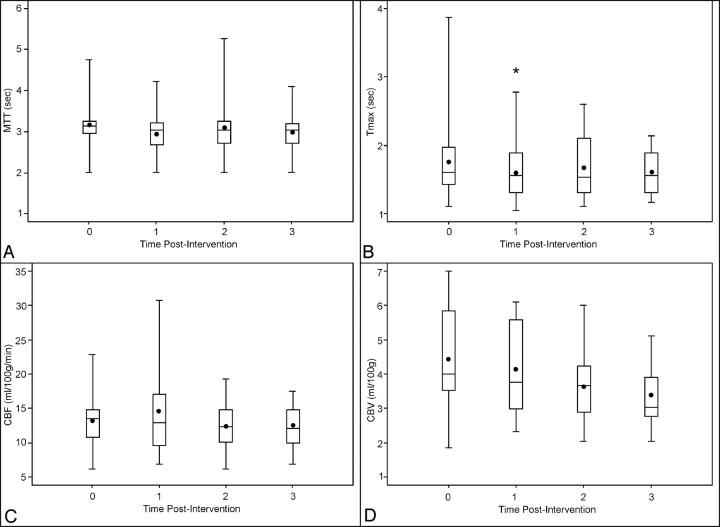
Fig 2.
The box-plot profiles of perfusion parameters measured with perfusion CT: MTT (A), Tmax (B), cerebral blood flow (C), and cerebral blood volume (D), by time 0 (preintervention), 1 (first day after intervention), 2 (2–5 days postintervention), to 3 (5–9 days postintervention). The plus signs are the sample mean values. The asterisk indicates P < .05 for the change from baseline.

