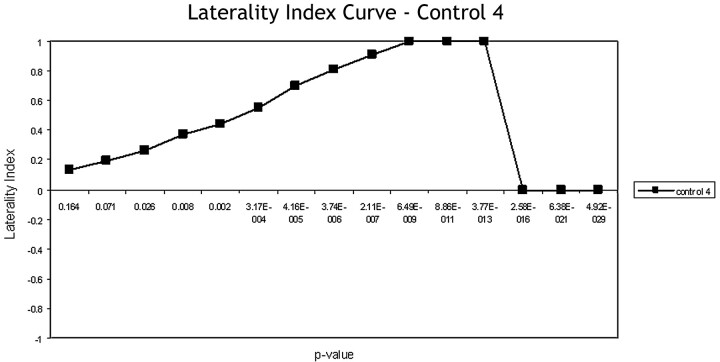
Fig 1.
The general LI curve starts near zero and rises as the significance (P value) increases as statistical stringency reveals the dominant hemisphere. The LI peaks at a value of +1 or −1 when either the left or the right hemisphere is dominant. At peak statistical stringency, no activated voxels survive and the curve drops back to zero.

