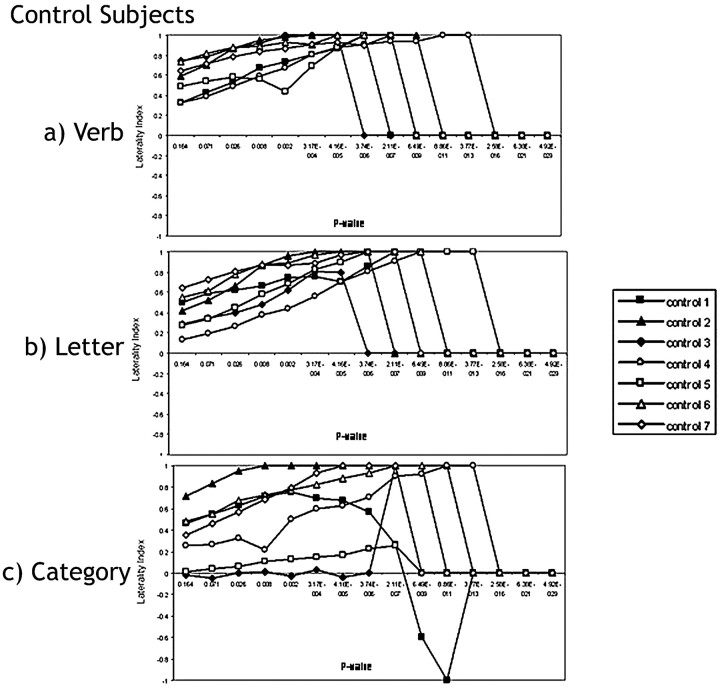
Fig 3.
Laterality index curves of controls performing the following: A, the verb-generation task. In all the control subjects, LI indicates complete left language lateralization in the Broca area across all P values. B, the letter task. All control subjects indicate left-hemispheric dominance in the Broca area except for control 4, whose fMRI suggests bilateral language representation at the highest 2 P values (P < .164 and P < .071), which are clinically insignificant. C, the category task. The individual laterality curves follow the expected pattern, except for control 1 and control 3. In control 1, the LI follows the normal trajectory from r = 0.25, P < .164 until r = 0.45, P < .002, where the LI curve then changes direction and becomes right-lateralized until it hits a peak of LI = −1 at r = 0.75, P < 8.86 × 10⁻¹¹. fMRI in control 3 indicates bilaterality for language in the Broca area across the entire range of P values measured except for at an r value of 0.65 (P < .3.74 × 10−6) when this subject's fMRI suggests left dominance for language.

