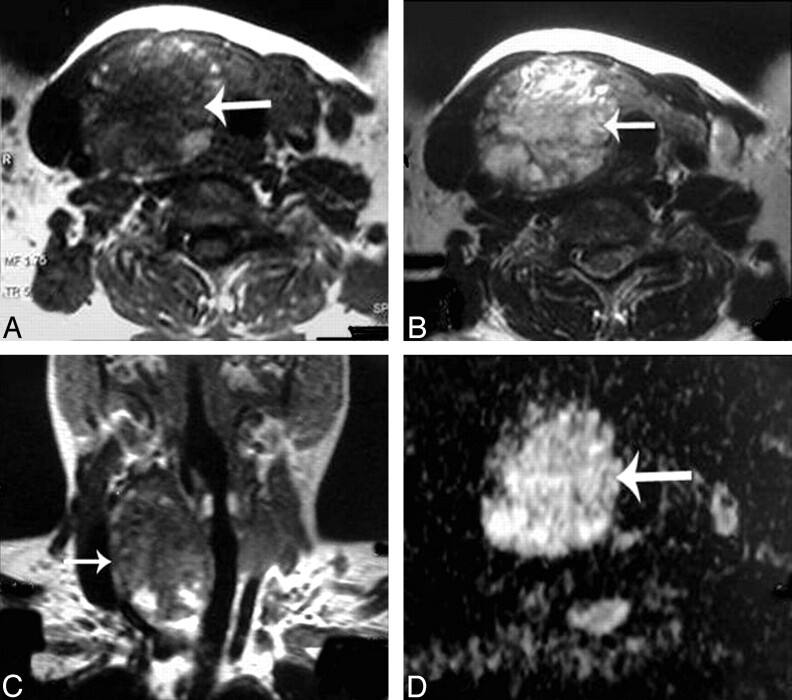
Fig 2.
Adenomatous nodule. A–C, Axial T1- and T2-weighted and coronal T1-weighted MR images of the neck, respectively, showing a well-defined oval mainly solid solitary nodule (arrow) affecting the right thyroid lobe with contralateral tracheal displacement. D, An ADC map image with hyperintensity of the nodule (arrow) denoting increased diffusion and a measured ADC value of 1.57 ± 0.11 × 10⁻³ mm2/s.

