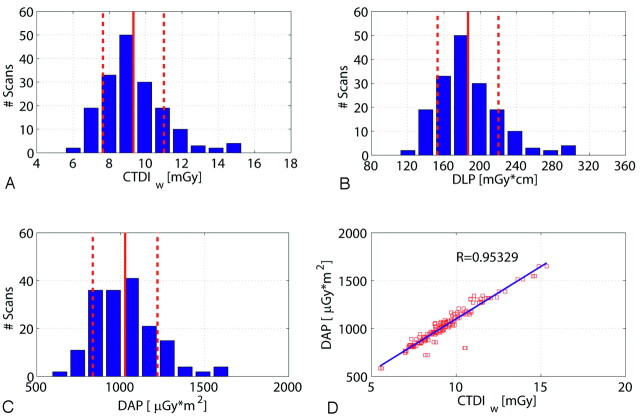
Fig 4.
Dose values for 172 patient scans regarding the high-speed (HS) protocol. A, B, and C show the histogram of the number of patient scans regarding the CTDIw, DLP, and DAP. The distributions are similar for the 3 dose measurement techniques. The DAP measured on-line shows a good linear correlation to the estimated CTDIw value (D). Note: The red lines and red dotted lines indicate the mean value and SD.

