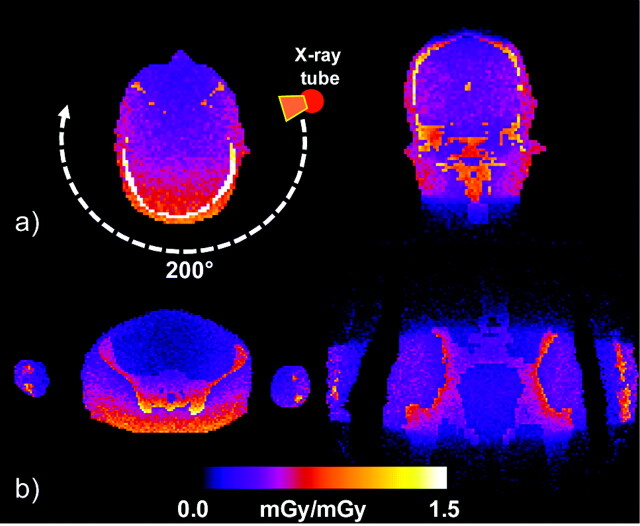
Fig 8.
Example of 3D dose distributions calculated by Monte Carlo simulations for 2 phantom planes (axial and coronal) with use of an anthropomorphic phantom for a 200° C-arm FPCT scan in relative units representing head and pelvis scans. The axial section nicely demonstrates the inhomogeneity of the dose distribution for a partial scan.

