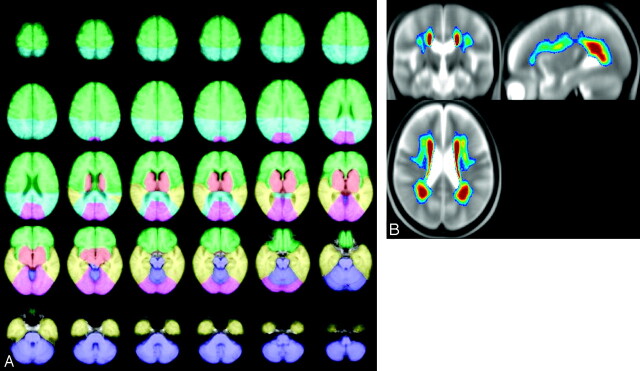
Fig 1.
The left panel shows axial views illustrating the delineation of 6 anatomic regions: frontal (green), parietal (turquoise), temporal (yellow), basal ganglia (red), occipital lobes (pink), infratentorial regions (purple); see details in text. The right panel shows the average distribution of ARWMC projected onto orthogonal sections of the group-averaged T2-weighted image. The color-coding indicates the frequency of ARWMC occurrence, ranging from 5% (dark blue) to 30% and above (dark red).

