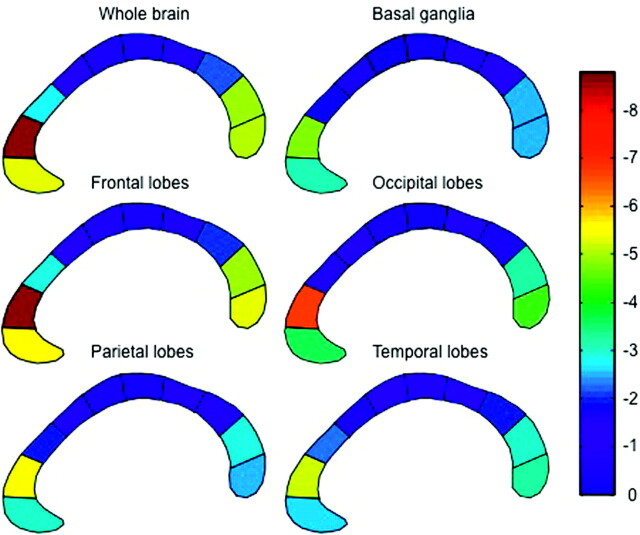
Fig 3.
The correlation between the area of each of the 10 CC subregions and the volume of ARWMC in each of 5 hemispheric regions and the whole brain. To obtain a better illustration of the regional specificity between CC atrophy and ARWMC, we subdivided the CC into 10 subregions and not 5 subregions as reported in Fig 2. The color code from blue to red indicates the magnitude of regression coefficients.

