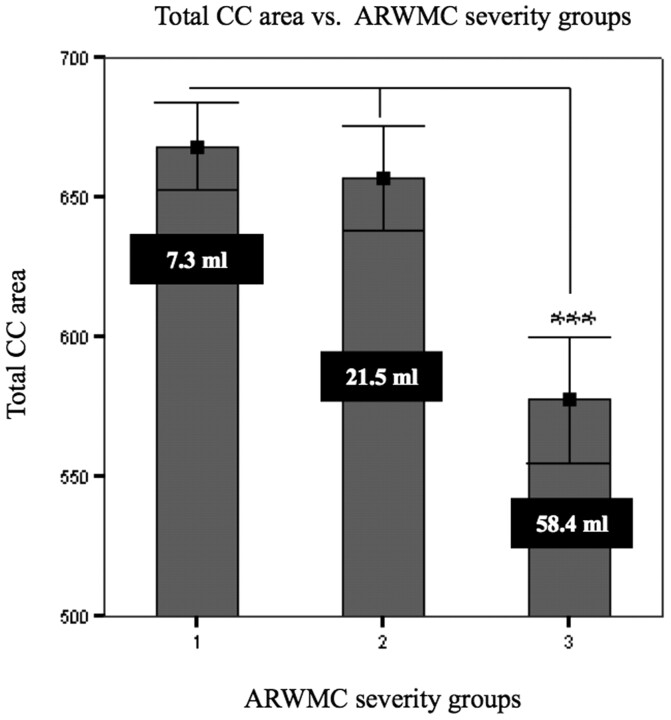
Fig 4.
Comparison of mean total callosal area measured on normalized MR imaging in nondisabled elderly subjects, classified by severity of ARWMC (Fazekas ratings 1, 2, and 3). Vertical bars indicate SDs. The white figures indicate the mean ARWMC volumes. Triple asterisks indicate P < .001 (ANOVA test).

