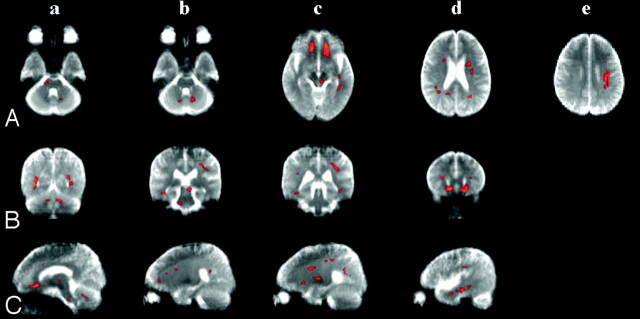
Fig 1.
Maps of significant voxels representing regions of reduction in FA in patients with essential tremor compared with control subjects (red) superimposed on the mean of their T2-weighted MR images (b = 0). The smoothed and masked FA maps were analyzed with SPM2, and a statistical map was generated with a significance threshold of Puncorrected < .005. Horizontal (A), coronal (B), and sagittal views (C). Anterolateral portion of the right the pons (A-a, B-b, and C-a); bilateral cerebellum (A-b, B-a, and C-a); left retrorubral area of the midbrain (A-c, B-b, and C-a); orbitofrontal white matter (A-c, B-d, and C-a); lateral frontal white matter (A-d, B-b, C-b, and C-c); parietal white matter (A-d, A-e, B-c, and C-c); and temporal white matter (A-c and C-d).

