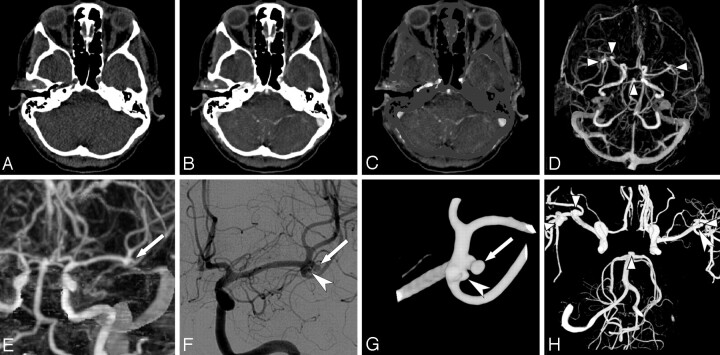
Fig 1.
Illustration of a MMBE procedure in a 44-year-old woman with a ruptured right middle cerebral artery (MCA) aneurysm. A–C, Axial images of nonenhanced low-dose CT, CTA, and CTA after MMBE. D, Axial MIP obtained after MMBE shows 2 right MCA aneurysms, 1 left MCA aneurysm, and a basilar tip aneurysm (arrowheads). E, Coronal MIP image of the left MCA shows a 2.8-mm MCA aneurysm (arrow) and deceptive thickening of the MCA bifurcation. F, DSA shows the same aneurysm (arrow) as in E, with an additional 1.6-mm MCA aneurysm (large arrowhead). G, 3DRA more clearly shows both MCA aneurysms (arrow and large arrowhead). H, Composite image of three 3DRAs of both ICAs and the right vertebral artery shows all 5 aneurysms (small arrowheads and large arrowhead).

