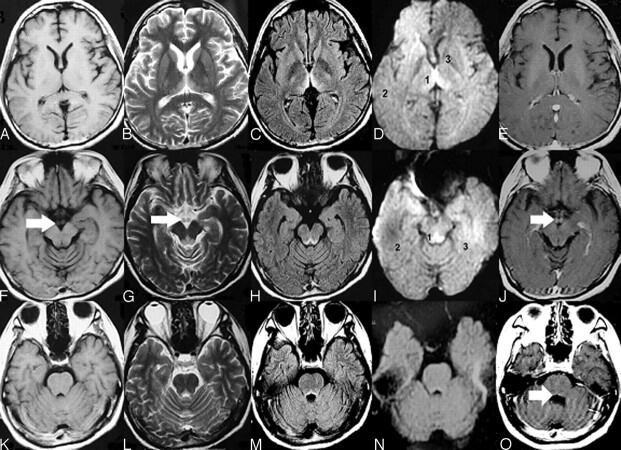
Fig 1.
Typical MR imaging features of nonalcoholic Wernicke encephalopathy. Axial T1-weighted images (A, F, K) show that no abnormal signal intensity was found. Axial T2-weighted (B, G, L), and FLAIR (C, H, M) images show increased signal intensity symmetric within the medial thalami (B, C), periaqueductal area (G, H), and floor of the fourth ventricle (L, M). DWI (D, I, N) imaging shows only slightly increased signal intensities within the bilateral thalami and periacqueductal area but no abnormal signal intensity in the other brain regions. (The ADC values of sites 1, 2, and 3 in the D image were 620.19 ± 27.39, 513.29 ± 9.60, and 381.92 ± 25.73, respectively; the ADC values of sites 1, 2, and 3 in the I image were 657.00 ± 43.13, 442.23 ± 15.43, and 494.94 ± 12.66, respectively.) Contrasting images (E, J, O) show that enhancement of the mammillary bodies and at the floor of the fourth ventricle by gadolinium contrast medium is found (J). No atrophy of the mammillary bodies (F, G, I, J) and cerebellar vermis (K, L, M, N, O) was found.

