Developmental venous anomaly (DVA) is the most common type of vascular malformation found at autopsy, with a prevalence of 2%.1 DVA is composed of radially arranged venous complexes converging to a centrally located venous trunk, which drains the normal brain parenchyma.2 Susceptibility-weighted imaging (SWI) shows low signal intensity for DVA due to the blood oxygen level–dependent (BOLD) effect in the abnormal medullary and draining veins.3 SWI has been successfully proved to have better detectability of venous structures than conventional T2*-weighted imaging.4 Our letter will present a DVA that showed isointensity compared with the surrounding cerebral parenchyma on SWI.
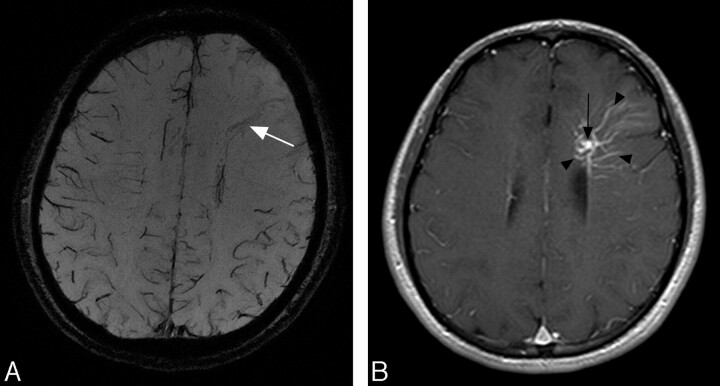
A 26-year-old man was referred to our institution due to an incidentally found DVA with no symptoms attributable to it. He underwent MR imaging examination, including SWI and MR angiography, in a 3T MR imaging scanner (Magnetom Trio; Siemens, Erlangen, Germany). MR imaging parameters of SWI were as follows: TR, 27 ms; TE, 20 ms; flip angle, 15°; FOV, 230 × 186 mm; matrix, 512 × 416; section thickness, 1.2 mm; 80 imaging sections; and scanning time, 6 minutes 50 seconds. Minimum intensity projection (MIP) images over 6 sections were created from phase and magnitude images. An MIP image of SWI showed a moderately low-signal-intensity structure corresponding to the draining vein; however, no low-signal-intensity structures corresponding to medullary veins (Fig 1A) were seen. Low-signal-intensity structures corresponding to the cortical veins of the other lobes were clearly shown; however, no apparent signals of cortical veins in the left frontal lobe were identified. Postcontrast T1-weighted images at 1.5T obtained 2 days after precontrast images revealed enhanced medullary veins and a draining vein (Fig 1B).
Fig 1.
A 26-year-old man with a DVA. A, MIP image of SWI shows a moderate low-signal-intensity structure corresponding to the draining vein (arrow); however, no low-signal-intensity structures corresponding to medullary veins are seen. Low-signal-intensity structures corresponding to the cortical veins of the other lobes are clearly shown; however, no apparent signals of cortical veins in the left frontal lobe are identified. B, Postcontrast T1-weighted images at 1.5T obtained 2 days after precontrast images reveal the enhanced draining vein (arrow) and medullary veins (arrowheads).
Signals on SWI are not compromised by low-velocity venous flow; therefore, SWI has successfully demonstrated low-flow vascular formations such as DVA.4 SWI at high-field MR imaging such as 3T allowed high-spatial-resolution images and better delineation of venous structures because the BOLD effect is related to the strength of the main magnetic field.3 In our case, SWI at 3T revealed no medullary veins of DVA, which implies that a relatively higher flow in the DVA reduced the amount of deoxyhemoglobin inside the DVA.
Our letter will add some information for interpretation of imaging findings on SWI, especially in the case of DVA with relatively higher flow. Neuroradiologists should keep such exceptional findings in mind in the interpretation of SWI.
This work was supported in part by a Health and Labour Sciences Research grant of Japan.
References
- 1.Garner TB, Del Curling O Jr, Kelly DL Jr, et al. The natural history of intracranial venous angiomas. J Neurosurg 1991;75:715–22 [DOI] [PubMed] [Google Scholar]
- 2.Abe T, Singer RJ, Marks MP, et al. Coexistence of occult vascular malformations and developmental venous anomalies in the central nervous system: MR evaluation. AJNR Am J Neuroradiol 1998;19:51–57 [PMC free article] [PubMed] [Google Scholar]
- 3.Reichenbach JR, Barth M, Haacke EM, et al. High-resolution MR venography at 3.0 Tesla. J Comput Assist Tomogr 2000;24:949–57 [DOI] [PubMed] [Google Scholar]
- 4.Lee BC, Vo KD, Kido DK, et al. MR high-resolution blood oxygenation level-dependent venography of occult (low-flow) vascular lesions. AJNR Am J Neuroradiol 1999;20:1239–42 [PMC free article] [PubMed] [Google Scholar]


