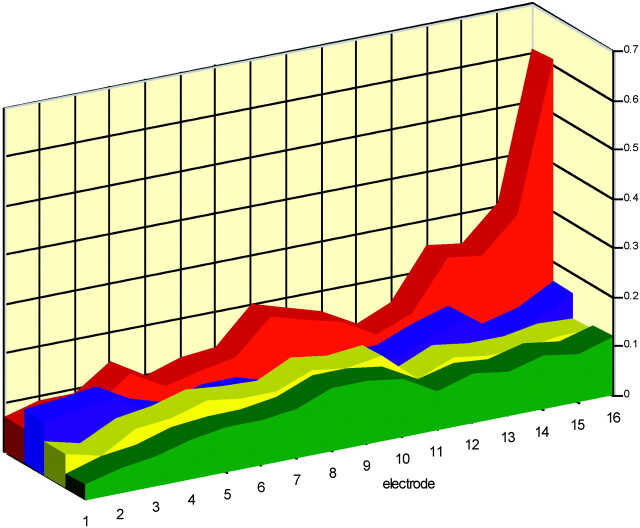
Fig 5.
Graphic presentation of the mean differences over 4 observers (y-axis) between electrode position as manually indicated and the position in the computer model (in millimeters). Values are shown per electrode contact (x-axis) for each scanner (Aquilion-64, yellow; Brilliance-64, blue; LightSpeed-64, red; Sensation-64, green). See also Table 3.

