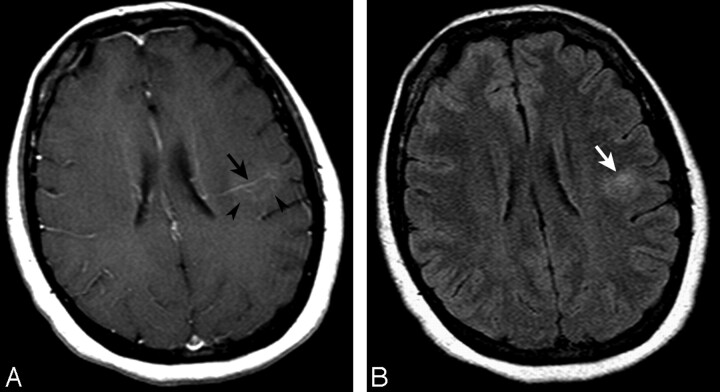
Fig 1.
Axial T1-weighted image after contrast administration (A) and a FLAIR image (B) demonstrating a left parietal subcortical DVA with deep venous drainage (black arrow, A). Some faint enhancement is seen within the DVA drainage territory (arrowheads, A). Associated signal-intensity abnormality surrounds the DVA, extending into the white matter (white arrow, B).

