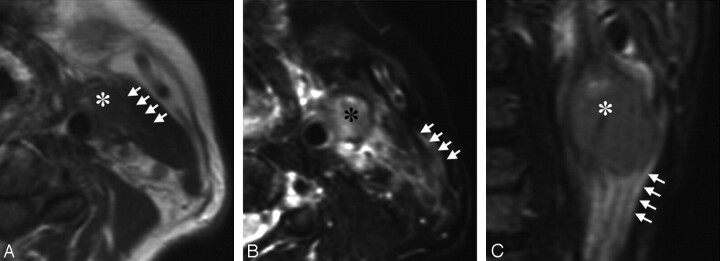
Fig 1.
A 63-year-old man with tongue carcinoma. A, Axial T1-weighted (TR/TE = 500/15) image shows an ENS-positive metastatic node (asterisk) at level II. Note the vanishing border sign (arrows) with obliteration of the fat layer between the node and the neighboring sternocleidomastoid muscle. B, Axial fat-suppressed T2-weighted (TR/TE = 4674/80 ms) image shows the flare sign that is around and extending from the same ENS-positive metastatic node (asterisk) as in A. Note that high-intensity signals are present in the interstitial tissues between the sternocleidomastoid muscle and the subcutaneous fat (arrows). C, Coronal fat-suppressed T2-weighted (TR/TE = 4674/80 ms) image shows the flare sign (arrows) caudal to the same ENS-positive metastatic node (asterisk) as in A and B.

