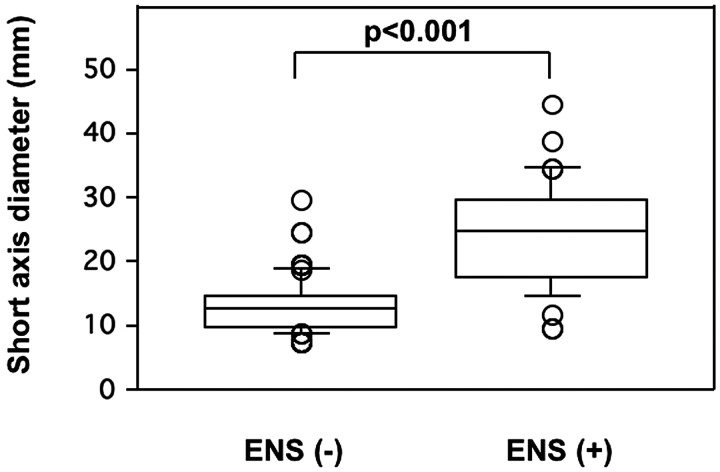
Fig 3.
Comparison of nodal sizes of ENS-positive and -negative metastatic nodes in the neck. Graph (boxplots) shows distributions of short-axis diameters of ENS-negative (−) (n = 130) and ENS-positive (+) (n = 47) metastatic nodes in the necks from 109 patients with head and neck cancers. The horizontal line is a median (50th percentile) of the measured volumes; the tops and bottoms of the boxes represent the 25th and 75th percentiles, respectively, and whiskers indicate the range from the largest to smallest observed data points within the 1.5 interquartile range presented by the box. The short-axis diameters of ENS (+) metastatic nodes are significantly greater than those of ENS (−) metastatic nodes (P value, Mann-Whitney U test).

