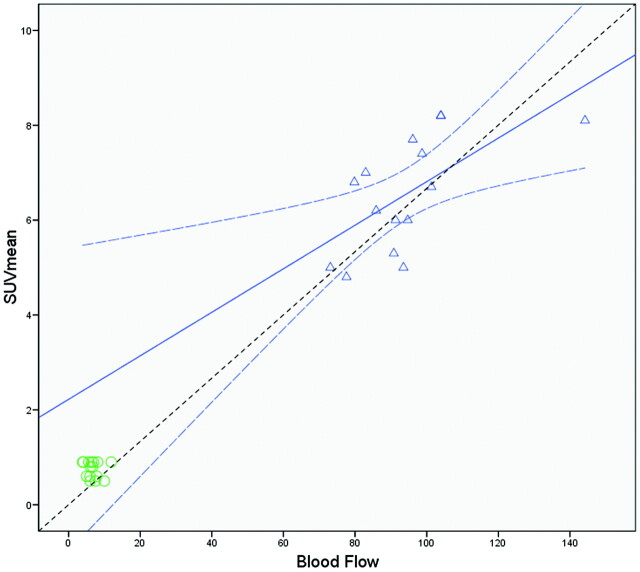
Fig 2.
Regression analysis of the mean BF values in the tumor (triangles) and healthy tissue (circles) with the SUVmean. There is a positive significant correlation (r = 0.63; P = .011) in the tumor ROIs. Linear regression analysis showed SUVmean = 0.05 × BF + 2.22 (R2 = 0.45; P = .011) (regression line). The curved dashed lines show the 95% confidence intervals for the tumor ROIs means. The dashed line depicts the line of perfect agreement (equation line).

