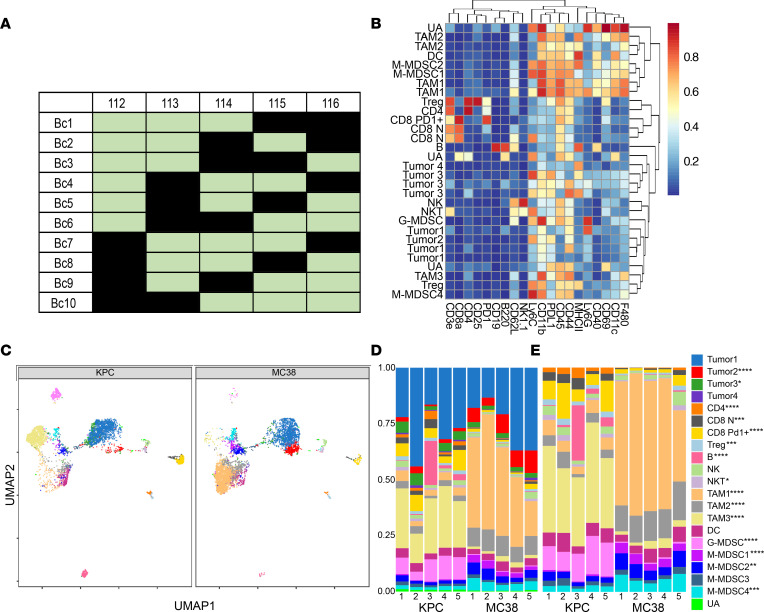
Figure 4. Demonstration of the barcoding strategy on mouse tumors.
(A) Using 112Cd-, 113In-, 114Cd-, 115In-, and 116Cd-conjugated anti-CD45, anti-CD29, and anti-CD98 antibodies, 10 unique barcodes were established based on a 5-choose-3 barcoding strategy. (B) Based on a data set using 20 markers in a mouse immune profile mass cytometry panel, the FlowSOM algorithm was then used to generate 30 metaclusters annotated into 21 final clusters. Displayed is the expression heatmap for all of the samples in the data set. (C) Phenotype clusters identified by FlowSOM clustering shown as a UMAP plot. (D) Stacked bars represent the percentage of total live cells per mouse tumor within each cluster. (E) Stacked bars represent the percentage of CD45+ cells for each mouse tumor within each live cell cluster. Color legends on the right apply to B–D. Cell type abundances with significant difference between the KPC and MC38 are annotated. FDR-adjusted P values by edgeR: ****P < 0.0001, ***P < 0.005, **P < 0.01, *P < 0.05. CD8 N, CD8+ naive T cells; TAM, tumor-associated macrophages; G-MDSC/M-MDSC, granulocytic/monocytic myeloid-derived suppressor cells; UA, unassigned.

