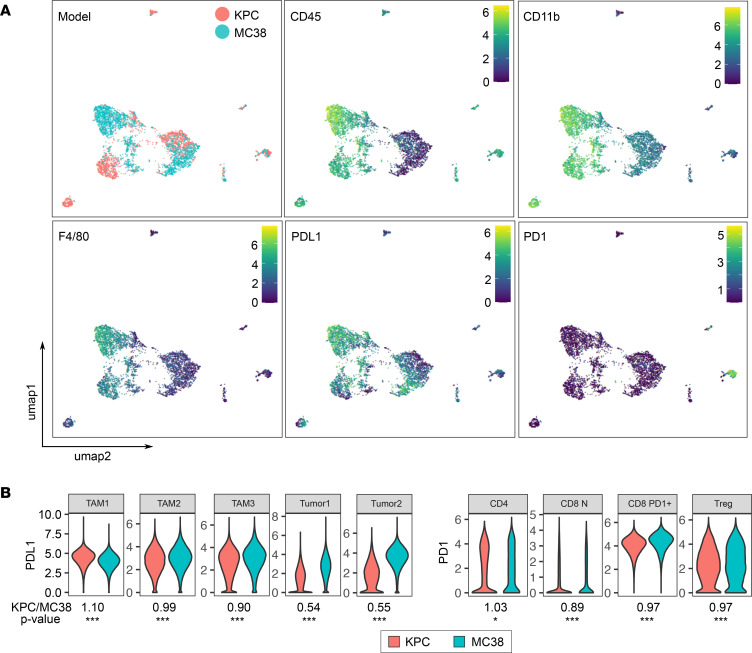
Figure 5. Comparison of PDL1-PD1 axis between KPC and MC38 tumor models.
(A) Representative UMAPs for the tumor model, CD45, CD11b, F4/80, PDL1, and PD1 expression. (B) Violin plots comparing the expression levels of PDL1 and PD1 in specific cell type clusters with annotations of median fold difference (KPC/MC38) and FDR-adjusted P values by edgeR: ***P < 0.005, *P < 0.05. Number of cells for each comparison of KPC versus MC38: TAM1, 55,607 versus 519,369; TAM2, 45,595 versus 122,957; TAM3, 373,020 versus 26,437; Tumor1, 511,692 versus 396,897; Tumor2, 32,692 versus 107,499; CD4, 30,656 versus 3229; CD8 N, 38,463 versus 6,339; CD8 PD1+, 102,213 versus 17,319; Treg, 23,766 versus 7928. CD8 N, naive CD8+ T cells; TAM, tumor-associated macrophages.

