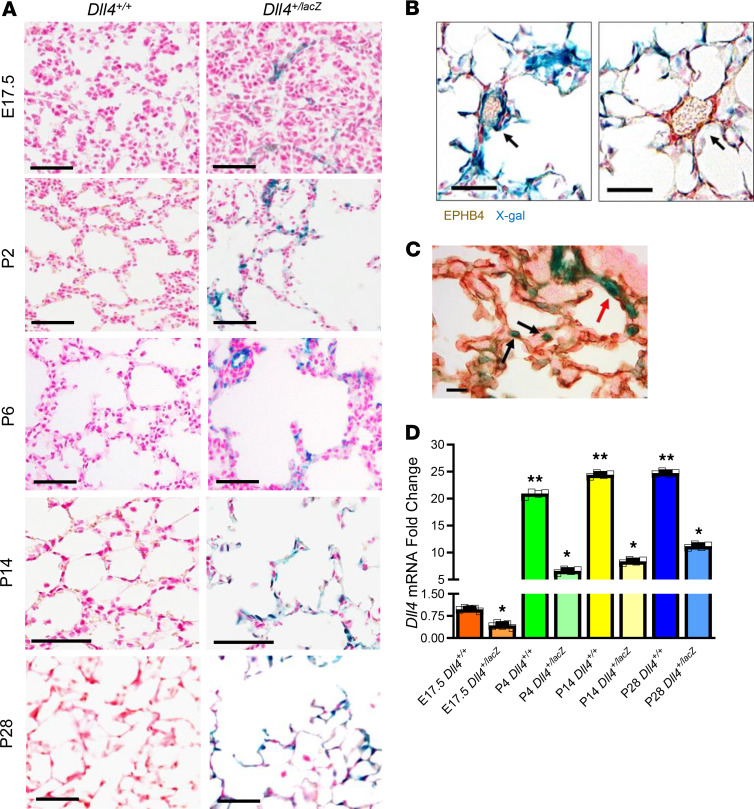
Figure 2. DLL4 lung mapping using the Dll4+/lacZ reporter mice.
(A) X-gal staining on Dll4+/+ and Dll4+/lacZ mouse lungs. Blue color represents lacZ gene expression, which indicates DLL4 expression, and fast red (red) represents nucleus (n = 3). Dll4+/+ samples were used as X-gal negative control. (B) X-gal and EPHB4 IHC (brown) staining on P14 mouse sample shows that DLL4 is not expressed in EPHB4+ cells. The arrow (left panel) points to an intermediate Dll4+ EPHB4– blood vessel, and the arrow (right panel) points to a Dll4– EPHB4+ blood vessel. (C) X-gal and PECAM IHC (brown) staining on P6 mouse lung sample. The black arrows point to the leading EC of blood vessel, and the red arrow points to a capillary branching from a small artery. (D) qRT-PCR showing mouse whole lung Dll4 expression from the canalicular to alveolar stage in WT and Dll4+/lacZ mice. n = 5 mice per group; *P < 0.01, E17.5 DLL4+/+ vs. P4, P14, P28 DLL4+/+ mice; **P < 0.01, E17.5 DLL4+/lacZ versus P4, P14, P28 DLL4+/lacZ mice. Scale bars: 50 μm (A and B); 10 μm (C). Data are shown as mean ± SD throughout. (D) One-way ANOVA with Tukey’s test.

