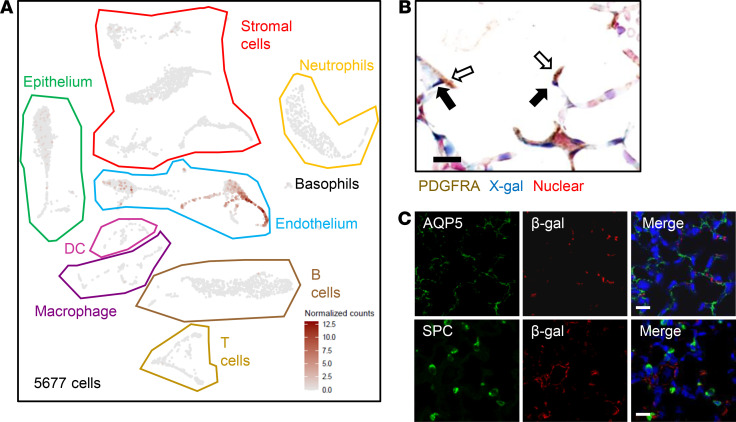
Figure 3. DLL4 prominently expresses in EC.
(A) Three C57BL/6 WT mouse lungs were collected on P14 for single-cell RNA-Seq, and Dll4 expression plot was generated from 5677 cells. Epithelium, endothelium (EC), and stromal cells were bordered by green, blue, and red lines separately. Note: DLL4 (brown dots) expression is predominantly in the EC cluster. (B) Dll4+/lacZ mouse lungs were harvested and cryosections were obtained on P14, and then X-gal staining and PDGFRA IHC staining were performed. Blue, brown, and red colors indicate X-gal, PDGFRA, and nuclear staining, respectively. Hollow arrows point to PDGFRA+ cells, and solid arrows point to X-gal+ cells. (C) Mouse lungs were harvested from 14-day-old Dll4+/lacZ mice. AQP5 (green) and SPC (green) (IF) were costained with β-galactosidase (red) separately. n = 5 per group. Scale bars: 10 μm.

