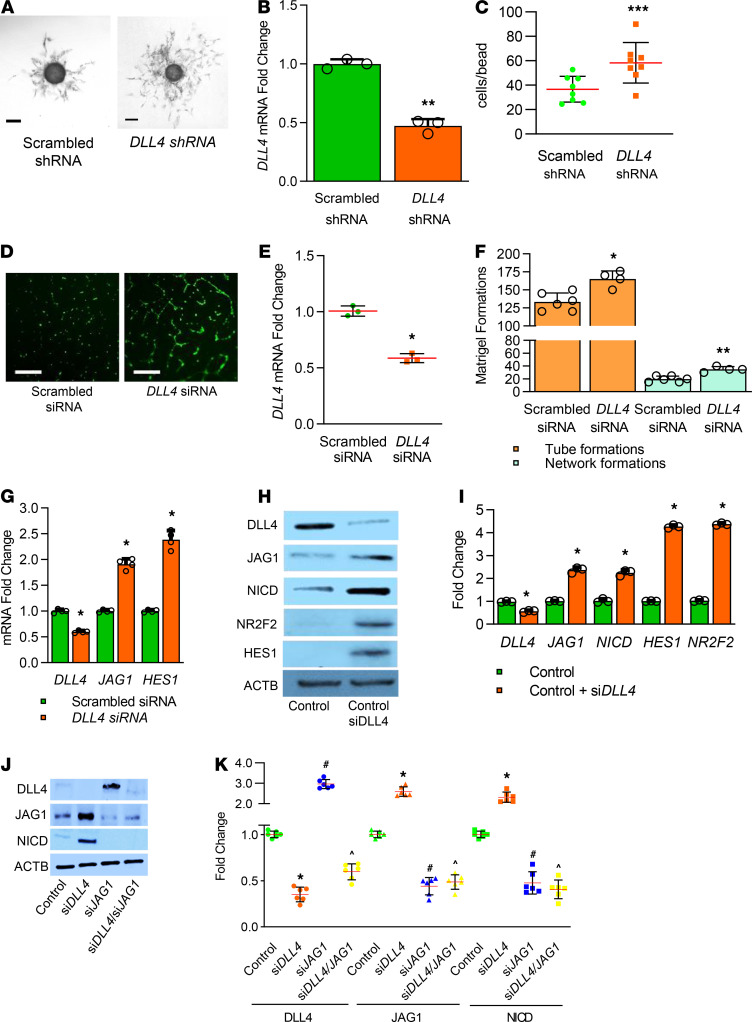
Figure 8. DLL4 deficiency programs a hypersprouting angiogenic phenotype in HLEC in vitro.
(A) DLL4-deficient HLEC-Im show hyperbranching network in 3D cell culture compared with control EC, with quantifications shown for average cell numbers per bead (C), 1–4 beads per well, 8 wells in both groups, P < 0.001. (B) qRT-PCR indicates that Dll4 is knocked down around 50% in DLL4-deficient HLEC-Im. n = 3 per group, P < 0.01. (D) DLL4 partially silenced in primary HLEC using siDLL4 shows increased branching and network formation in Matrigel compared with EC treated with scrambled siRNA with quantifications shown graphically (F), *P < 0.02, **P < 0.01. (E) qRT-PCR indicates that siDLL4 reduced DLL4 in primary HLEC by around 50%. N = 4 per group, P < 0.03. (G) qRT-PCR from HLEC shows a 50% decrease with siDLL4 and an increase in both JAG1 and HES1. n = 4 per group; *P < 0.03, control vs. siDLL4. (H) HLEC were harvested after siRNA treatment and homogenates were used to quantify DLL4, JAG1, NICD, NR2F2, and HES1 by immunoblotting, with densitometry shown graphically (I). n = 3 per group; *P < 0.01, scrambled siRNA vs. siDLL4. (J) HLEC were harvested after scrambled siRNA, siDLL4 or siJAG1 treatment and homogenates were used to quantify DLL4, JAG1, and NICD by immunoblotting, with densitometry shown graphically (K). n = 5 per group; *P < 0.01, control vs. siDLL4; #P < 0.01, control vs. siJAG1; ^P < 0.01, control vs. siDLL4/siJAG1. Scale bars: 250 μm (A); 100 μm (C). Data are shown as mean ± SD. (C and K) Gaussian distribution used 1-way ANOVA with Tukey’s test) (B, E, F, and I) Gaussian distribution with 1 comparison used 2-tailed t test with Welch’s correction. (G) Non-Gaussian distribution used 2-tailed Mann-Whitney U test.

