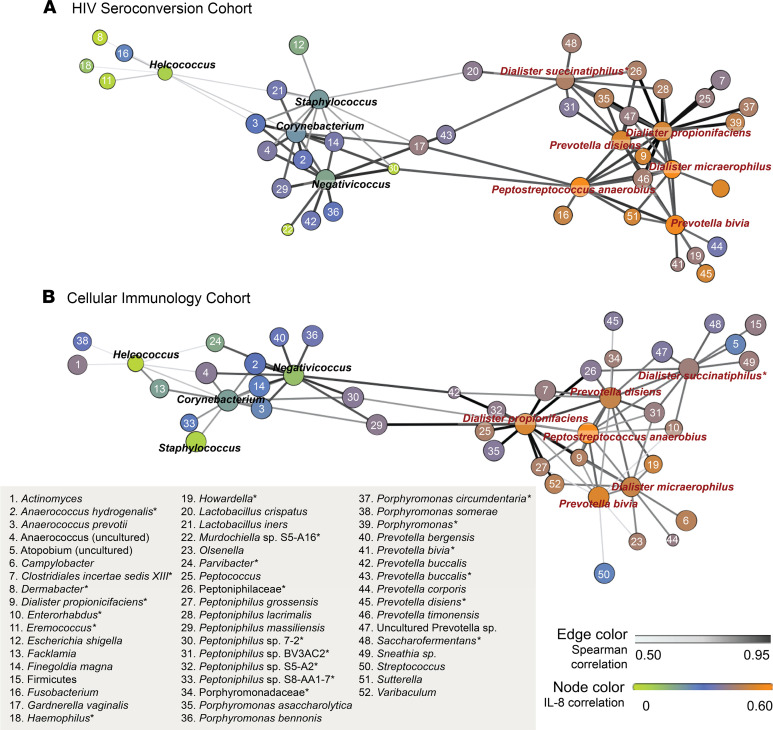
Figure 4. Penile bacterial community network structure is conserved across cohorts, with clustering of BASIC species.
Penile microbiome network structures are conserved across 2 independent study cohorts, the HIV seroconversion cohort (n = 188) (A) and the cellular immunology cohort (n = 90) (B). Network structure displays the correlation of the 6 BASIC species and their 10 most correlated genera/species (species are listed). Correlation between species is denoted by the spatial location of nodes and edge color; node size displays species prevalence. Species-level correlations with subpreputial IL-8 are displayed by node color. Correlations were assessed by Spearman’s test.

