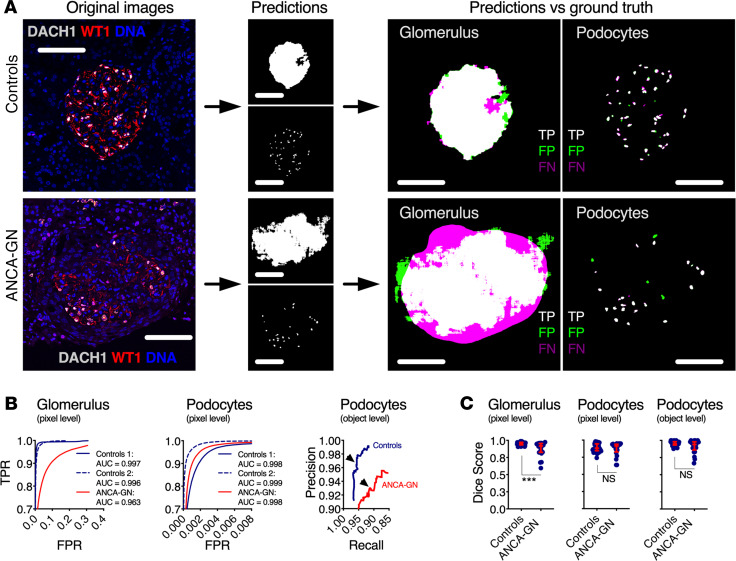
Figure 3. Application of segmentation U-Net to human kidney biopsies.
(A) Visual representation of the segmentation process, from original images, to segmentation outputs for glomeruli and podocytes, and their respective correlation with manually segmented ground truths, highlighting true positives, false positives, and false negatives. (B) Receiver operating characteristic (ROC) and precision-recall curves in samples from controls and ANCA-GN patients; arrowheads show selected thresholds for both conditions (n = 20 images for Controls 1, n = 24 images for Controls 2, and n = 21 images for ANCA-GN patients). (C) Dice scores at pixel and object levels for glomeruli and podocytes, showing comparable segmentation performance in health and disease (n = 44 images for controls and n = 21 images for ANCA-GN patients; Mann-Whitney U tests were performed). In dot plots, each blue dot represents 1 image, and red error bars represent medians and IQRs. ANCA-GN, antineutrophil cytoplasmic antibody–associated glomerulonephritis; DACH1, Dachshund Family Transcription Factor 1; WT1, Wilms’ Tumor 1; TPR, true positive rate; FPR, false positive rate; TP, true positives; FP, false positives; FN, false negatives. ***P < 0.001. Scale bars: 100 μm.

