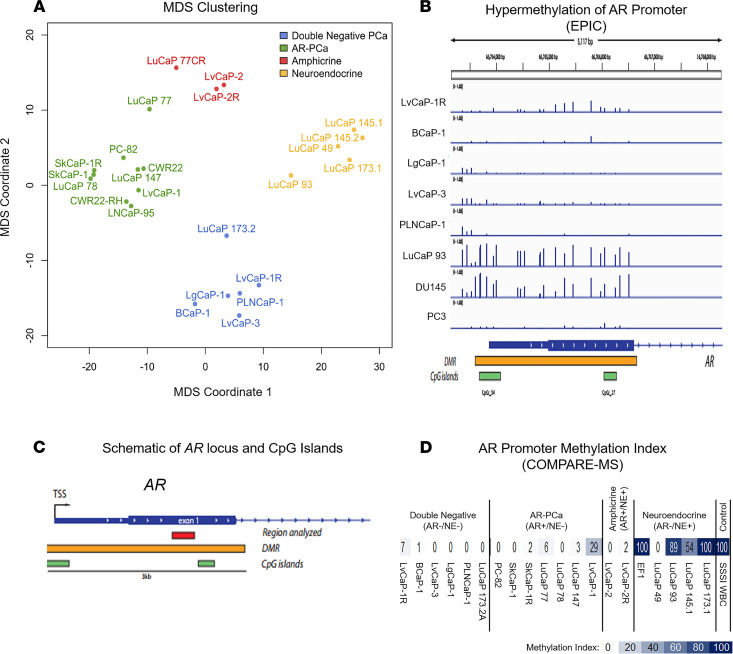
Figure 10. Clustering of lethal mCRPC PDXs and analysis of AR promoter methylation.
(A) Clustering of PDX models based on multidimensional scaling. (B) Analysis of methylation levels at the single CpG level using Illumina EPIC arrays reveals hypermethylation of a region encompassing the transcriptional start site and the first exon of AR in LuCaP 93 and DU145 cells. (C) Schematic of the AR locus showing CpG islands, the putative differentially methylated region, and the region interrogated in this COMPARE-MS study. (D) Heat map of methylation indices in the first exon of AR in PDX lines as assessed by COMPARE-MS. mCRPC, metastatic castration-resistant prostate cancer; PDXs, patient-derived xenografts.

