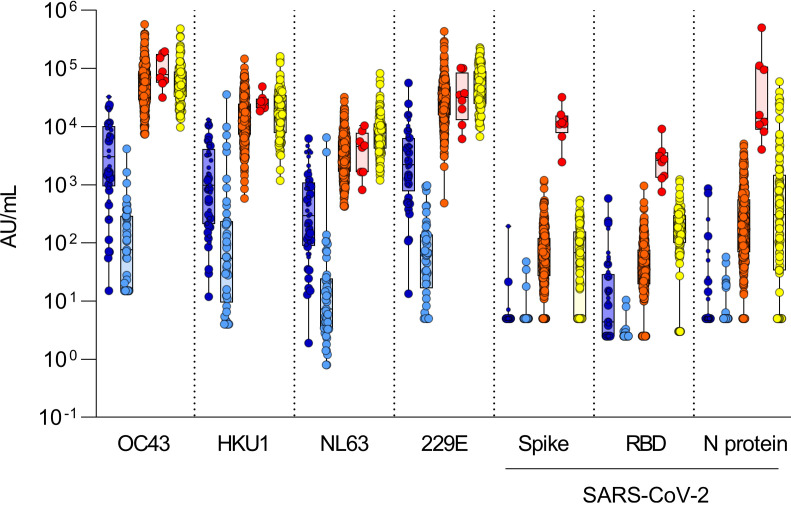
Figure 3. Thresholds of antibody reactivity based on infants’ sera.
Comparison of antibody reactivity (AU/mL) in infants sampled before 6 months of age (darker blue) and again about 8 months later (lighter blue; n = 45), in SARS-CoV-2–uninfected (orange; n = 273), in SARS-CoV-2–infected (convalescent) adults (red; n = 8), and in prepandemic sera (yellow; n = 99). Infants sampled before the pandemic (January 1, 2020) are represented by the larger circle symbols, whereas infants sampled after January 1, 2020, are shown using the small circle symbols. Boxes represent median with 25th and 75th percentiles with positive/negative antibody reactivity thresholds for SARS-CoV-2 spike calculated at the 99th percentile for value distribution (10.00 AU/mL), RBD (10.00 AU/mL), and N protein (10.00 AU/mL) as 10(mean log[antibody reactivity] + SD log [antibody reactivity] × 2.33) in infants’ sera. Antibody detection for NTD was low and inconsistent between experiments; therefore, the data are not presented and reactivity thresholds were not calculated.

