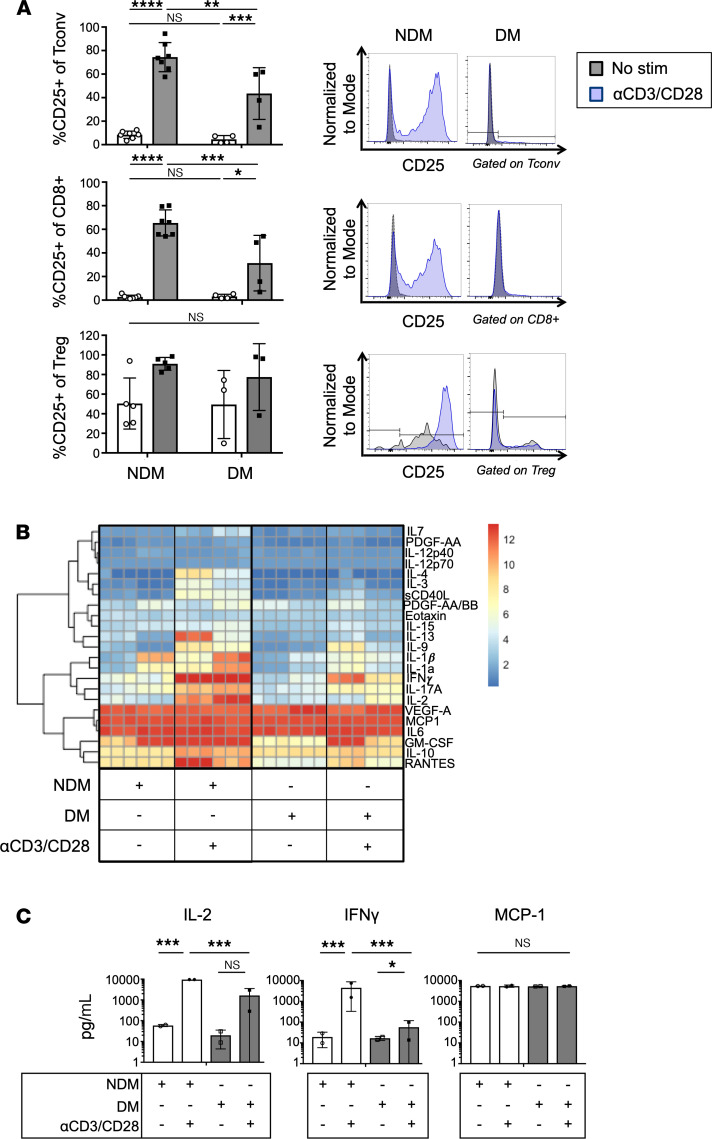
Figure 2. Inflammatory capacity of human ATTs is reduced in diabetic bariatric surgery patients.
(A) Frequency of CD25 expression on human oWAT ATTs after activation assays with αCD3/CD28 Dynabeads. CD25 induction is compared with the HbA1c of the patient from whom the oWAT biopsy was taken. Representative histograms of CD25 expression compared with unstimulated controls shown on the right. n = 4–7 biological replicates/group, analyzed by 2-way ANOVA where *P < 0.05, **P < 0.01, ***P < 0.001, ****P < 0.0001. (B and C) Luminex assessment of supernatants taken from T cell activation cultures. NDM (HbA1c < 5.7) and DM (HbA1c > 6.5), and IL-2, IFN-γ, and MCP1 cytokines in culture supernatants from human ATT activation assays depicted in bar graphs. n = 2 biological replicates/group, 3 technical replicates, analyzed by 2-way ANOVA where *P < 0.05, ***P < 0.001.

