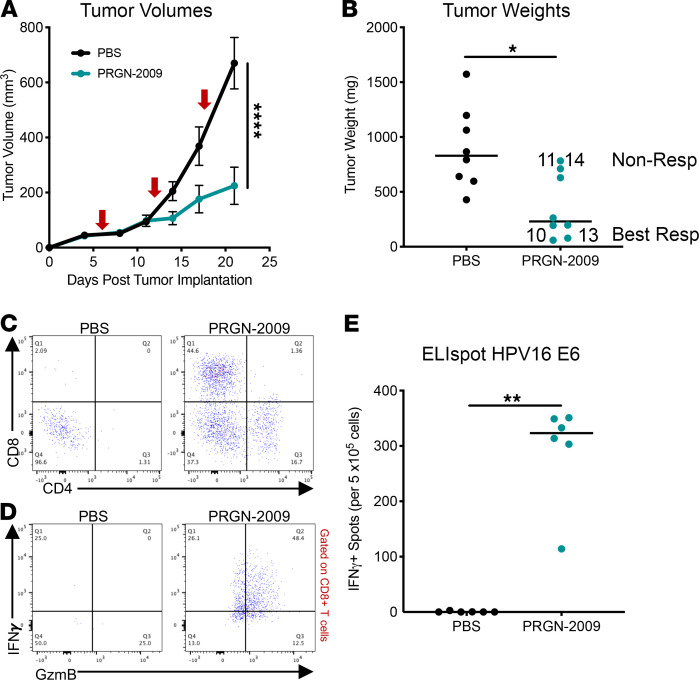
Figure 3. Treatment with PRGN-2009 resulted in decreased tumor volumes and induction of antigen-specific T cells in the TC-1 syngeneic mouse model.
C57BL/6 mice bearing s.c. TC-1 HPV16+ tumors were treated with 3 weekly s.c. injections of PBS control (100 μL) or PRGN-2009 (1 × 10⁹ VP), starting on day 4 after tumor implantation (red arrows). (A) Average tumor volumes of PRGN-2009 versus control-treated mice; P < 0.0001. (B) Tumor weights (medians) at the end of study; P < 0.05. Mice nos. 10 and 13 were defined as Best Responders, with tumor weights below the group median, and mice nos. 11 and 14 were defined as Nonresponders, with tumor weights above the group median (Table 1). (C and D) Flow cytometry of single-cell suspensions of tumors. (C) CD8+ and CD4+ T cell tumor infiltration are shown from a representative mouse from each group. (D) Multifunctional (IFN-γ+GzmB+) CD8+ T cell infiltration from 1 representative mouse from each group. (E) Splenocytes from 6 mice from each group were stimulated with overlapping HPV16 E6 15-mer peptides in an ELIspot assay. The graph shows the number of SFCs per 2.5 × 10⁵ splenocytes of PRGN-2009– versus control-treated mice after deducting the negative control. Mann-Whitney U and repeated measures ANOVA tests were used. *P < 0.05, **P < 0.01, ****P < 0.0001. SFCs, spot-forming cells; VP, virus particles.

