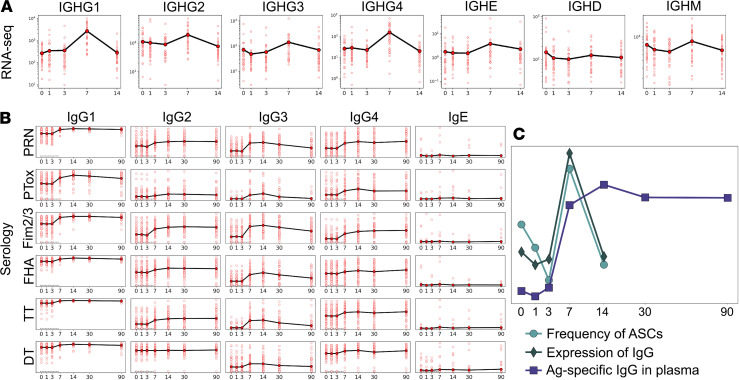
Figure 5. Longitudinal patterns of humoral response.
In all plots, the x axis denotes days after vaccination. Averaging is done within all cohorts. (A) Expression of Ig constant regions from RNA-Seq for a total of 36 donors (n = 36). (B) Tdap-specific IgG subclass titers (log10-scaled) from plasma expressed in the mean of 58 donors (n = 58). (C) Overlay of values from RNA-Seq (n = 36), antibodies (n = 58), and CyTOF (n = 18) combined measurements. Average of PC1 across all the profiled donors is plotted for RNA-Seq and IgG titers data, as well as the cell frequency specific for ASCs.

