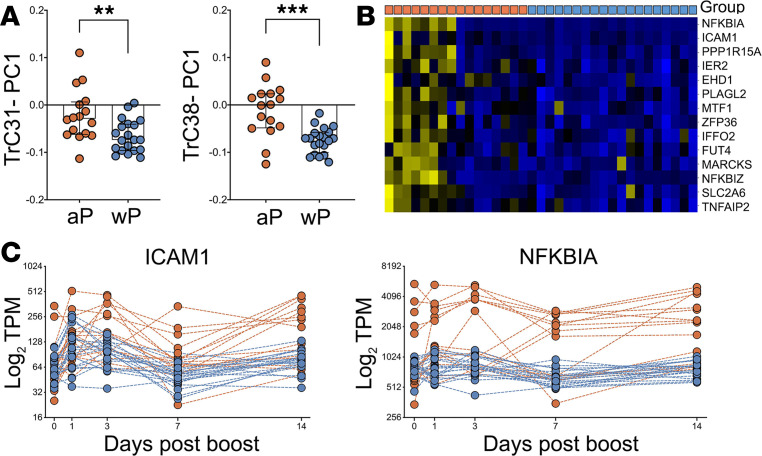
Figure 6. Gene expression differences in aP versus wP individuals on day 7.
(A) Expression of the genes in clusters TrC31 and TrC38 is significantly different 7 days after boost in aP versus wP individuals (n = 16 for aP and n = 20 for wP) as quantified by the principal component analysis (PC1). Statistical differences were evaluated using a 2-sided, nonparametric Mann-Whitney U test (**P = 0.006, ***P = 0.0002). Median and IQR are represented by box and error bars, respectively. (B) Heatmap of 14 genes from clusters Trc31 and -38 that were identified as differentially expressed on day 7 (Benjamini-Hochberg Padj < 0.05). Columns denote group of individuals originally primed with either aP or wP as indicated by orange versus blue boxes in the top row (n = 16 for aP and n = 20 for wP). (C) Expression level of ICAM1 and NKBIA over time as representative genes in clusters TrC31 and TrC38, respectively, that are differentially expressed on day 7 between aP and wP individuals (n = 16 for aP and n = 20 for wP).

