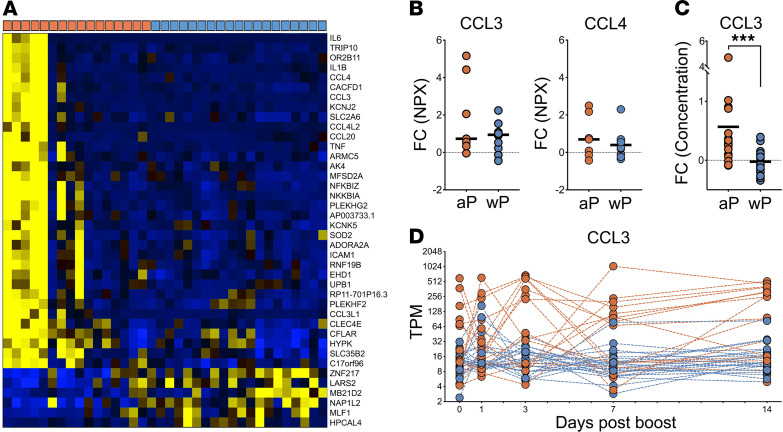
Figure 7. Observed differences in aP and wP-primed individuals on day 3.
(A) Heatmap of genes differentially expressed between the cohorts on day 3. Columns denote different individuals primed with aP versus wP, as indicated by orange or blue boxes, respectively, in the top row (n = 16 for aP and n = 20 for wP). (B) Differences in plasma concentration of CCL3 and CCL4 between day 0 and day 3 based on change of NPX values as obtained by PEA assay in human plasma (n = 6 for aP and n = 10 for wP). (C) Log2 fold change from preboost to day 3 of plasma concentrations of CCL3 by ELISA. Statistical differences were evaluated using a 2-sided, nonparametric Mann-Whitney U test (***P = 0.0002). (D) Modulation of CCL3 gene expression over time. aP and wP donors are represented in orange and blue, respectively (n = 16 for aP and n = 20 for wP).

