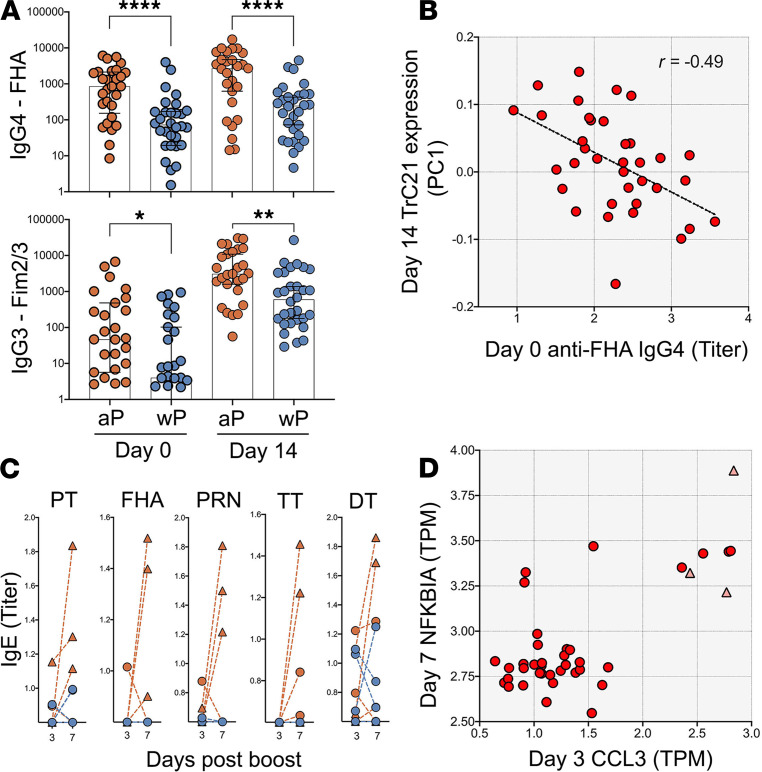
Figure 8. Differences in humoral responses against the pertussis vaccine antigens in aP versus wP donors.
(A) FHA and Fim2/3 prior to booster vaccination and 14 days after. Statistical differences between aP and wP primed individuals (n = 28 for aP and n = 30 for wP) were evaluated using a 2-sided, nonparametric Mann-Whitney U test (****P < 0.0001, **P = 0.0015, *P = 0.0141). Geometric mean and SD are represented by error bars. (B) IgG4 antibody titers prior to boosting (x axis) negatively correlate with the expression of module TrC21 14 days after boost. Correlation was evaluated using Spearman’s correlation test (r = –0.49) (n = 36). (C) IgE level modulation over time for the several antigens in individuals vaccinated with aP (red) or wP (blue lines) in infancy (n = 28 for aP and n = 30 for wP). Three individuals from the aP group (triangles) showed consistent increases of IgE from day 3 to day 7 after booster vaccination. (D) Scatter plot of RNA-Seq gene expression data of NFKBIA on day 7 (y axis) versus CCL3 expression on day 3 (x axis). The 3 individuals with consistent IgE responses are marked with red triangles (n = 36).

