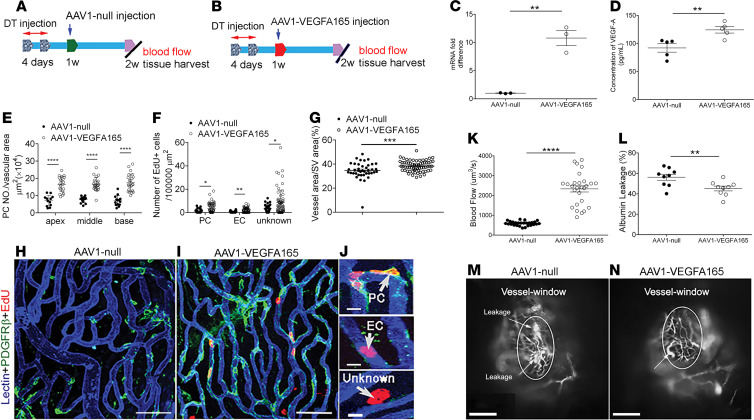
Figure 6. VEGFA165 gene therapy enhances pericyte survival, promotes pericyte regeneration, and attenuates vascular damage.
(A and B) Time points of gene delivery and related measurements. (C and D) VEGFA165 mRNA and protein are significantly increased in the AAV1-VEGFA165 gene–treated cochleae compared with the control AAV1-treated cochleae (VEGFA165 mRNA: n = 3 for each group; VEGFA165 protein: n = 6 for each group; and **P < 0.01 by Student’s t test). (E) The pericyte population is higher in the AAV1-VEGFA165 gene–treated group (n = 7) compared with the control AAV1-treated group (n = 4, ****P < 0.0001 by Student’s t test). (F) Increased EdU+ cells in the VEGFA165 gene–treated group (n = 7) compared with the control AAV1 group (n = 4, *P < 0.05, and **P < 0.01 by Student’s t test). (G) Decreased vascular density is attenuated by AAV1-VEGFA165 gene treatment (n = 7) but not by control AAV1 treatment (n = 4, ***P < 0.001 by Student’s t test). (H and I) Confocal images show EdU+ pericytes, endothelial cells, and an unidentified cell type in the stria of control AAV1 (H) and AAV1-VEGFA165 groups (l). (J) Zoomed-in images highlight different types of EdU+ cells in the stria of an AAV1-VEGFA165–treated animal. (K) Blood flow volume in the AAV1-VEGFA165–treated group is significantly greater than in the control AAV1 group (n = 3, ****P < 0.0001 by Student’s t test). (L) Vascular leakage is markedly attenuated in the AAV1-VEGFA165–treated group relative to the control AAV1 group (n = 3 for each group, **P < 0.01 by Student’s t test). (M and N) IVM images from control AAV1 and AAV1-VEGFA165 groups (white arrows, leaking sites). Data are presented as a mean ± SEM. Scale bars: 50 μm (H, I), 10 μm (J), 100 μm (M, N). PC, pericyte; EC, endothelial cell.

