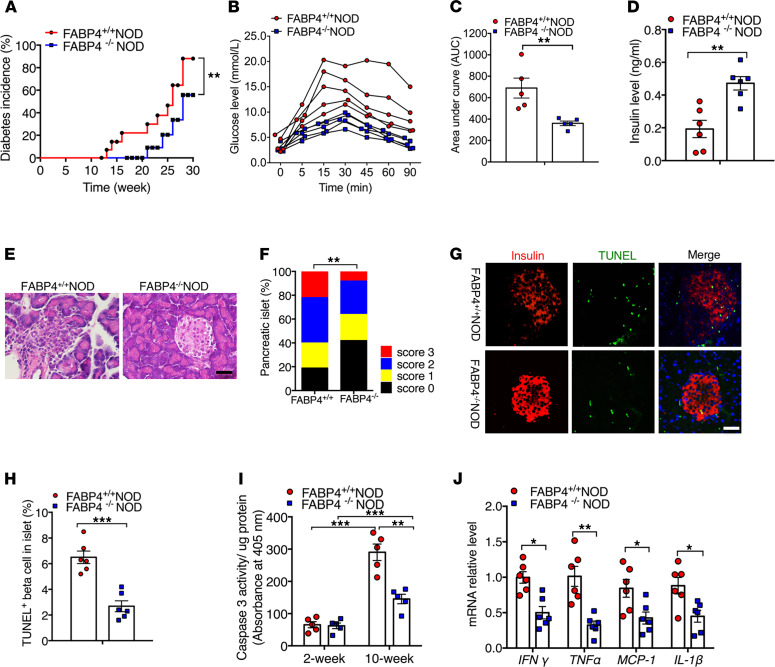
Figure 4. Genetic disruption of FABP4 alleviates autoimmune destruction of β cells and diabetes in NOD mice.
(A) Incidence of diabetes in FABP4+/+NOD and FABP4–/–NOD mice at different ages. Diabetes incidence was diagrammed with the Kaplan-Meier method, and incidences between different groups were compared with the log-rank test (n = 18). (B) Glucose excursion curve for each individual mice after receiving glucose challenge, (C) the quantification of area under curve in glucose tolerance test, and (D) circulating insulin levels at 16 weeks of age (n = 6). (E) Representative images of H&E analysis for pancreatic sections and (F) insulitis scores in 10-week-old female FABP4+/+NOD and FABP4–/–NOD mice (n = 6). (G) Representative images of IHC staining of TUNEL (red) and insulin (green) in pancreases of 10-week-old female FABP4+/+NOD and FABP4–/–NOD mice. Scale bar: 20 mm, with original magnification of 400× (n = 6). (H) The quantification of absolute TUNEL-positive β cells in islets (n = 6). (I) Caspase-3 activity in islets lysate of 2-week- and 10-week-old FABP4+/+NOD and FABP4–/–NOD mice measured by Caspase-3 Fluorometric Assay Kit (n = 6). (J) The relative mRNA abundance of inflammatory cytokines (IFNγ, TNFα, IL1β, and MCP1) in the islets of FABP4+/+NOD and FABP4–/–NOD mice (n = 6). Data are expressed as mean ± standard deviation. Statistical significance was determined by 1-way analysis of variance or Student’s t test. *P < 0.05, **P < 0.01, ***P < 0.001.

