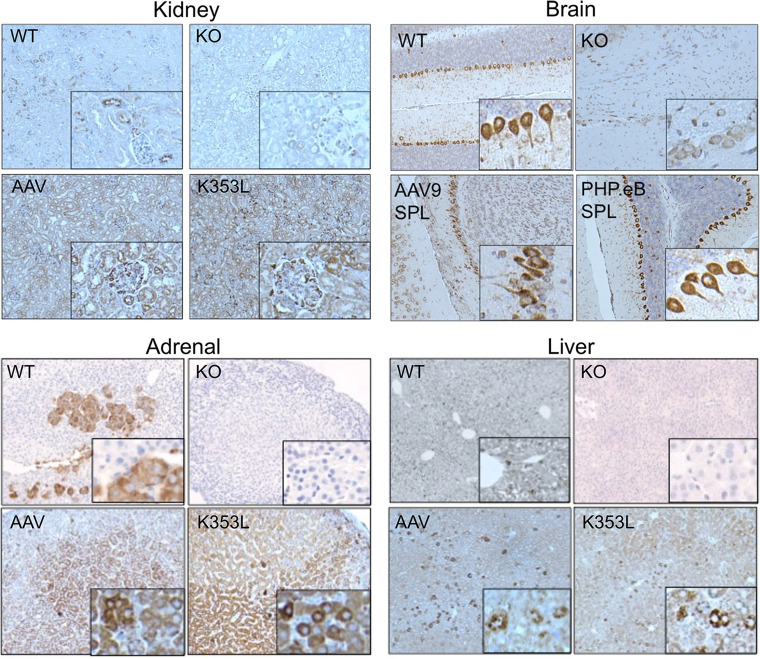
Figure 10. Expression pattern of mSPL and hSPL in murine tissues.
IHC was performed on fixed tissue sections from WT, KO, AAV-SPL–treated KO (AAV), and AAV-SPLK353L–treated KO (K353L) mice. For WT tissues, staining was performed using anti-mSPL. For all other groups, staining was performed with anti-hSPL. KO tissues were also stained with anti-mSPL and were negative for signal (data not shown). Brain tissues from KO mice treated with PHP.eB-hSPL are shown in comparison with AAV9-hSPL. Insets show enlarged image detail for each quadrant to highlight cells with positive signal; original magnification, ×20.

