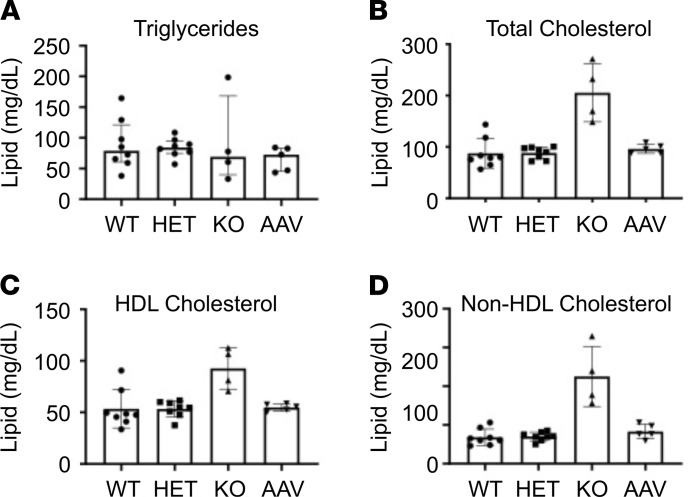
Figure 8. Plasma lipids of treated and untreated Sgpl1-KO mice.
Plasma (A) triglycerides, (B) total cholesterol, (C) HDL-cholesterol, and (D) non–HDL-cholesterol (LDL, IDL, and VLDL) were measured in plasma of WT (n = 8), heterozygous (HET) (n = 8), KO (n = 4), and AAV-SPL–treated KO (AAV) mice, (n = 5). All mice were euthanized at 28 DOL. For triglycerides, 1-way ANOVA was applied, and there were NSDs between any of the groups. For all other lipids, 1-way ANOVA was used to compare WT, HET, and AAV-SPL, and unpaired t test was used to compare KO and WT. Comparing KO vs. WT: (B, P = 0.0006); (C, P = 0.007); (D, P = 0.0002). There are NSDs between WT, HET, and AAV-SPL for any of the lipids.

