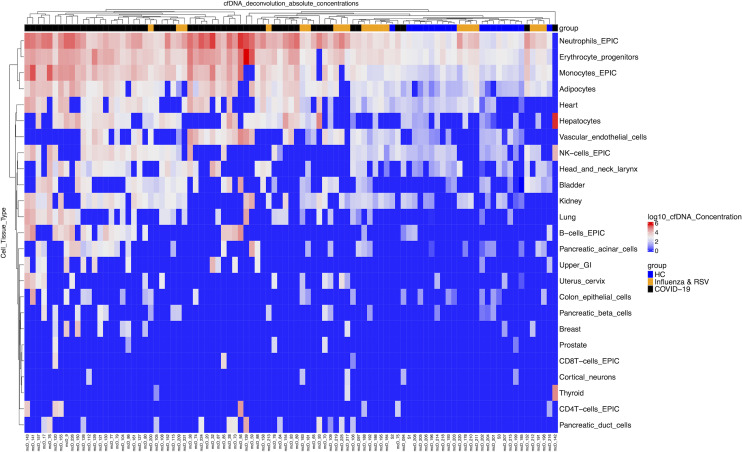
Figure 2. Absolute concentrations of cfDNA from different tissue types in patients.
Heatmap plot showing unsupervised clustering of cfDNA concentrations from different tissue sources (copies/mL in log scale), each column representing individual patients, which include COVID-19 patients (n = 55, black), healthy controls (n = 19, blue), and a comparator group of patients with influenza or respiratory syncytial virus (n = 21, orange). cfDNA from individual tissue types were quantified by bisulfite sequencing, analyzing tissue-specific DNA methylation signatures. cfDNA concentration is represented in copies/mL of plasma and reported in log scale from lowest (blue) to highest (red) values.

