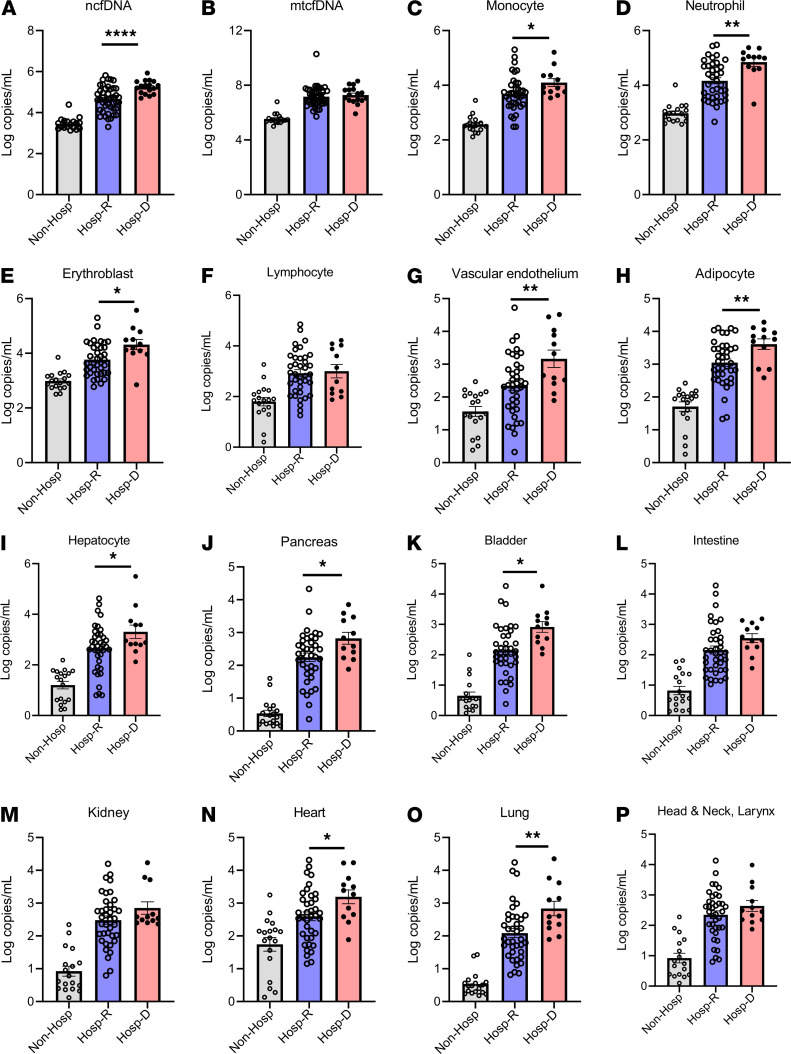
Figure 4. Plasma cfDNA levels by COVID-19 outcome.
Patients were stratified by COVID-19 outcomes as nonhospitalized, representing patients with mild disease who did not require hospitalization (Non-Hosp), gray (n = 18); hospitalized patients who recovered (Hosp-R), light blue (n = 48); or hospitalized who died (Hosp-D), light red (n = 18). (A) Nuclear cfDNA (ncfDNA), (B) mitochondrial cfDNA (mtcfDNA), and cfDNA from different tissue types (C–P) are shown for the 3 groups of COVID-19 patients. Only cfDNA measurements early in the COVID-19 illness were considered (the first sample per patient, typically days 0–2 of admission for hospitalized patients or close to testing for patients with mild COVID-19). The following tissue types are shown: (C) monocytes, (D) neutrophils, (E) erythroblasts, (F) lymphocytes, (G) vascular endothelial cells, (H) adipocytes, (I) hepatocytes, (J) pancreas, (K) bladder, (L) colon enterocytes, (M) kidney, (N) heart, (O) lung, and (P) head and neck larynx. Bar graphs expressed as mean ± SEM. Statistical significance levels for each pairwise comparison were determined using adjusted P values computed based on Hommel’s procedure. Adjusted P values are shown. P values less than 0.05 were considered statistically significant; *P < 0.05, **P < 0.01, and ****P < 0.0001.

