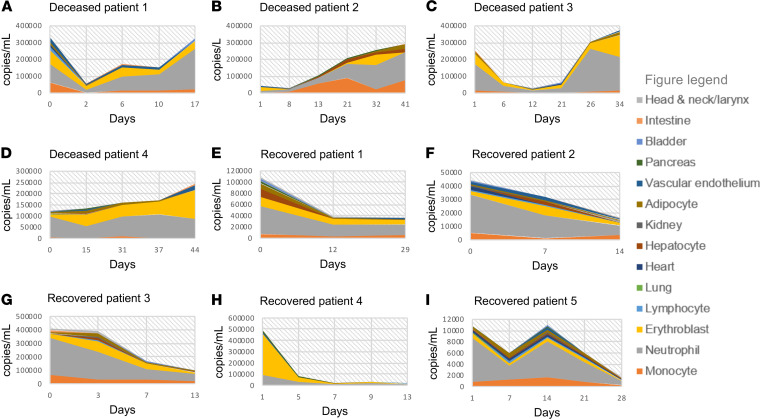
Figure 6. Kinetics of cfDNA profiles for patients by COVID-19 outcome.
Changes in tissue-specific cfDNA measures over time for prototype COVID-19 patients who required intensive care and recovered (Recovered) or died (Deceased); an increasing cfDNA trend in Deceased (A–D) and a decreasing cfDNA trend in Recovered (E–I). cfDNA concentration in copies/mL is represented in the y axis and days from hospital admission represented in the x axis (day 0 representing the day of hospital admission). cfDNA from individual tissue type is shown and a figure key is represented.

