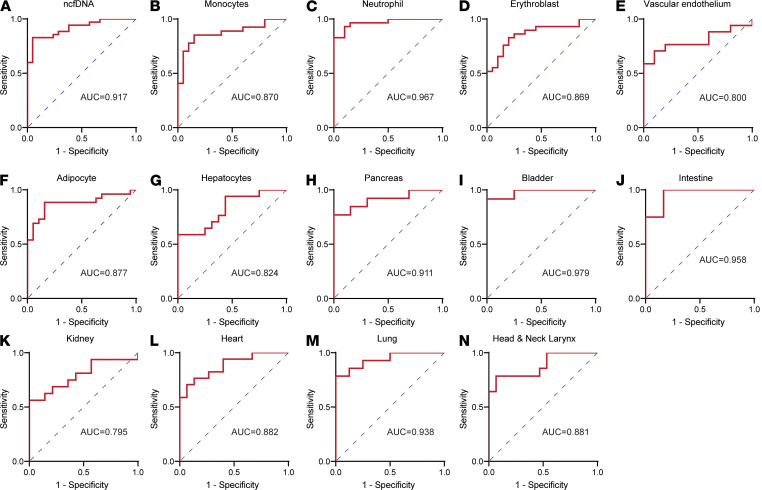
Figure 8. cfDNA profile distinguishes patients by COVID-19 severity.
Receiver operating characteristic (ROC) curve analysis of cfDNA measures early at admission as predictor and maximum COVID-19 severity during illness as outcome variable. ROC analysis showing performance of cfDNA profiles to distinguish hospitalized patients who subsequently required ICU versus hospitalized patients who did not: (A) ncfDNA-, (B) monocyte-, (C) neutrophil-, (D) erythroblast-, (E) vascular endothelium– (F) adipocyte-, (G) hepatocyte-, (H) pancreas, (I) bladder-, (J) intestine-, (K) kidney-, (L) heart-, (M) lung-, and (N) head and neck larynx-derived cfDNA.

