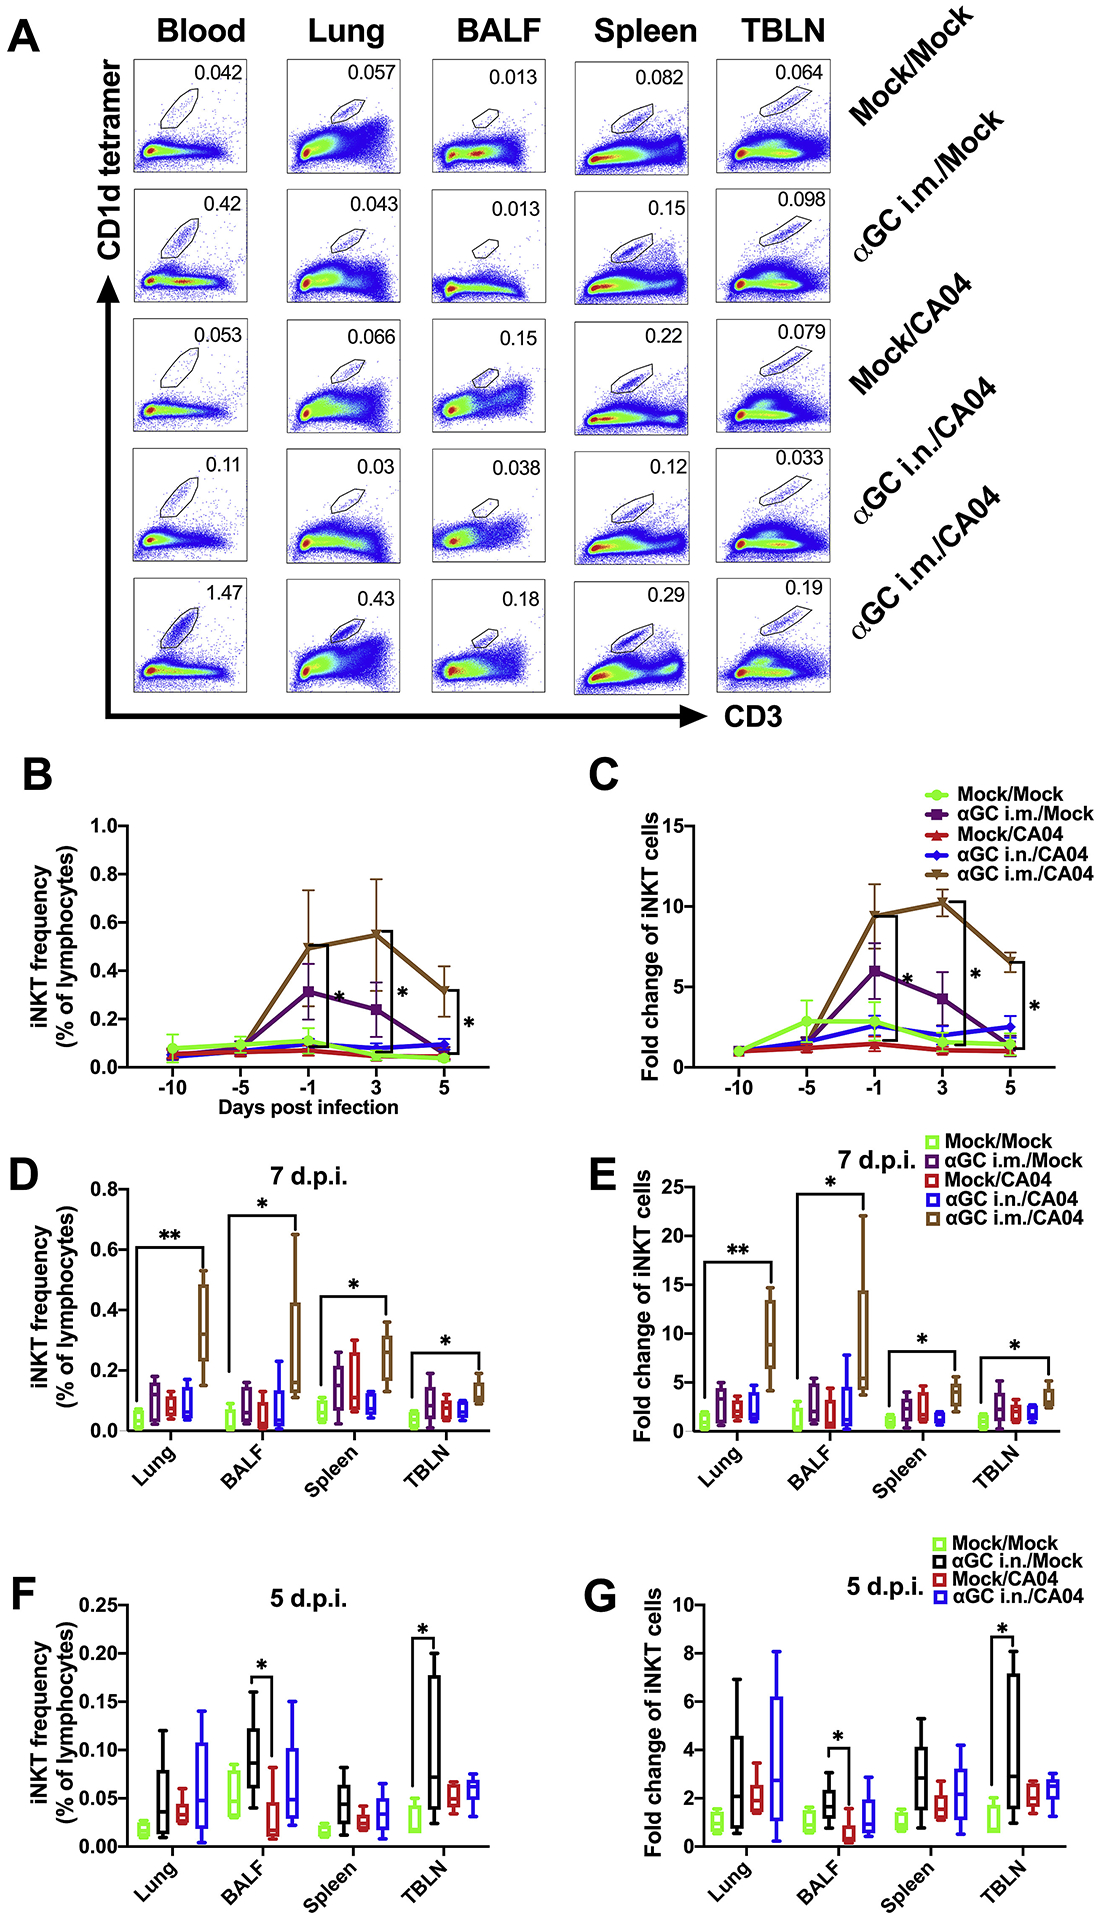
Figure 1.

Flow cytometric analysis of iNKT cell levels. (A-E) Frequency of iNKT cells in peripheral blood (PB) and tissues in Experiment 1 when pigs were administrated α-GalCer (αGC) i.m. or i.n. 9 days prior to infection with CA04. (A) Representative flow cytometry plots showing iNKT cells in PB at 3 d.p.i. and various tissues at 7 d.p.i.. (B) Frequency of PB iNKT cells as a percentage of lymphocytes at −10, −5, −1, 3, 5 d.p.i.. (C) Fold change of iNKT cell frequency compared to the same pig at −10 d.p.i.. (D) Tissue and BALF iNKT cells as a proportion of lymphocytes at 7 d.p.i.. (E) Fold change of tissue and BALF iNKT cell frequency compared to the average iNKT cell frequency of Mock/Mock pigs. (F-G) Frequency of iNKT cells in tissues in Experiment 2 when pigs pigs were treated with α-GalCer i.n. 2 days before challenge with CA04. (F) Frequency of iNKT cells in BALF and various tissues as a proportion of total lymphocytes collected at 5 d.p.i.. (G) Fold change of tissue and BALF iNKT cells compared to the average iNKT cell frequency of Mock/Mock pigs. Data are represented as mean ± SEM. Differences in PB iNKT cell levels were analyzed using the Kruskal-Wallis test and the Dunn’s test was used to compare treatments at each time point and within each tissue. *P < 0.05.
